|
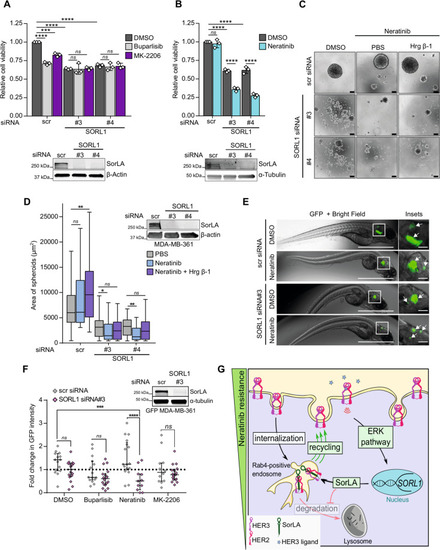
SorLA silencing specifically reverts resistance to neratinib in vitro and in vivo.A, B SorLA silencing and neratinib show synergistic effects in inhibiting MDA-MB-361 cell growth. Control- and SorLA-silenced MDA-MB-361 cells were treated with either the pan-PI3K inhibitor buparlisib (500 nM), the pan-AKT inhibitor MK-2206 (500 nM) or the dual HER2/EGFR tyrosine kinase inhibitor neratinib (300 nM) for 48 h. Cell viability was measured using WST-8-based method. Values are represented as fold change relative to DMSO-treated control MDA-MB-361 cells. A representative western blot validating SorLA silencing is shown. C, D SorLA-silencing exhibits a synergistic effect with neratinib in inhibiting anchorage-independent spheroid growth of MDA-MB-361 cells in 3D low-attachment cell culture conditions. Control- and SorLA-silenced MDA-MB-361 cells were grown in low-attachment cell culture conditions for 7 days in the presence of the indicated treatments. Scale bar 100 µm. Spheroid sizes are quantified in and a representative western blot validating SorLA silencing are shown in (D). N > 50 spheroids per group. E Control and SorLA-silenced GFP-MDA-MB-361 cells were engrafted in the brain of zebrafish embryos and allowed to grow for 4 days in the presence of DMSO control or neratinib (400 nM). Representative GFP + Bright Field images of brain tumors are shown. Scale bars: 1 mm. Scale bars (insets): 100 µm. F Control- and SorLA-silenced GFP-MDA-MB-361 cells were engrafted in zebrafish brain and allowed to grow for 4 days in the presence of DMSO, buparlisib (2 µM), neratinib (400 nM) or MK-2206 (400 nM). Tumor growth is represented as fold change in GFP intensity relative to day 1 post-engraftment. A representative western blot validating SorLA silencing is shown. G A representative scheme of a neratinib resistance mechanism driven by a feed-forward loop supporting SorLA-HER2-HER3 expression. Key elements of this loop are highlighted in green boxes. HER2-HER3 signaling increases SORL1 expression through the ERK pathway. Increased SorLA levels prevent HER2-HER3 lysosomal degradation (red arrow with lined arrowhead) presumably by stimulating receptor recycling from Rab4-positive endosomes (green arrows). Data are (A and B), mean ± SD from three 3 independent biological replicates; (D), Box plots representing median and interquartile range; whiskers extend to maximum and minimum values, and (F), median with interquartile range. Statistical analysis: (A, B), two-way ANOVA, Dunnett’s multiple comparisons test. (D), One-way ANOVA, Dunn’s multiple comparisons test. (F), two-way ANOVA, Dunnett’s multiple comparisons test (main SorLA silencing effect P < 0.0001). Scr: control non-targeting siRNA.
|