
Fig. 5
- ID
- ZDB-FIG-210307-85
- Publication
- Al-Akhrass et al., 2021 - A feed-forward loop between SorLA and HER3 determines heregulin response and neratinib resistance
- Other Figures
- All Figure Page
- Back to All Figure Page
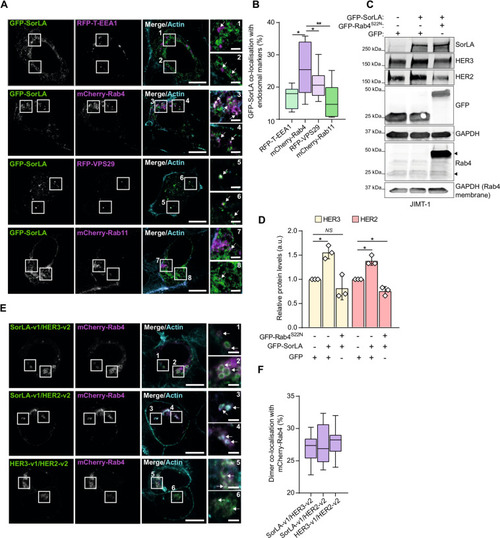
A Representative Airyscan confocal microscopy images of BT-474 cells coexpressing GFP-SorLA with the indicated endosomal markers. SiR-Actin was used for counterstaining the actin cytoskeleton. White arrows depict colocalizing signals. Scale bars: 10 µm. Scale bars (insets): 2 µm. B GFP-SorLA strongly colocalizes with mCherry-Rab4 in BT-474 cells. Colocalization was calculated (see “Methods”) from BT-474 cells transfected and imaged as in (A). N = 36 cells per group. C JIMT-1 cells were cotransfected with GFP-SorLA and either GFP control or GFP-Rab4S22N dominant-negative mutant. Representative immunoblotting of SorLA, HER2, HER3, GFP, and Rab4, with α-tubulin as a loading control. GFP immunoblot detects GFP control and GFP-Rab4S22N proteins. The higher molecular weight GFP-SorLA was probed with anti-SorLA primary antibody. In the Rab4 immunoblot, the upper arrowhead indicates GFP-Rab4S22N and the lower arrowhead the endogenous protein. D Quantification of HER2 and HER3 levels normalized to loading control and relative to control GFP-transfected cells. E Representative confocal microscopy images of BT-474 cells co-overexpressing mCherry-Rab4 with the indicated BiFC dimers. SiR-Actin was used for counterstaining the actin cytoskeleton. White arrows depict colocalizing signals. Scale bars: 10 µm. Scale bars (insets): 2 µm. F Colocalization analysis between BiFC and mCherry-Rab4. N = 30 cells per group. D Data are mean ± SD from three independent biological experiments; statistical analysis: Student’s t test (unpaired, two-tailed, unequal variance). B and F Box plots represent median and 25th and 75th percentiles (interquartile range), and whiskers extend to maximum and minimum values; three biological replicates. Statistical analysis: One-way ANOVA, Dunn’s multiple comparisons test. |