
Fig. 4
- ID
- ZDB-FIG-210303-91
- Publication
- Mukherjee et al., 2020 - Ccn2a/Ctgfa is an injury-induced matricellular factor that promotes cardiac regeneration in zebrafish
- Other Figures
- All Figure Page
- Back to All Figure Page
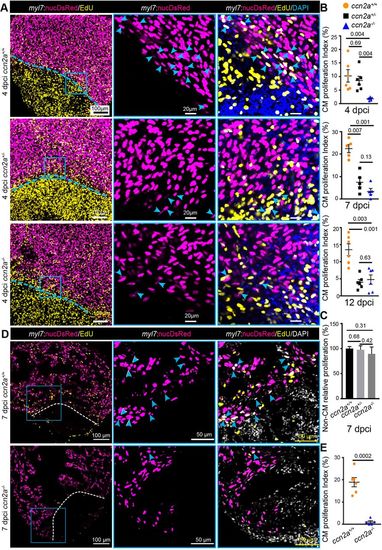
ccn2a mutants display reduced cardiomyocyte proliferation post-cryoinjury. (A) Panels in the left column show maximum intensity projections (25-35 µm) of confocal images of 4 dpci whole-mount hearts stained for EdU (yellow; marks proliferating cells) and stained with DAPI (blue; marks all nuclei). DsRed marks CM nuclei. The corresponding high-magnification single-plane optical sections are shown in the middle and right columns. Arrowheads indicate EdU+/DsRed+ cells. Dotted lines mark the injury border. (B) The percentage of proliferating CMs in the border zone (up to 100 µm away from the injury border) was quantified in whole-mount ccn2a+/+, ccn2a+/− and ccn2a−/− hearts at 4 dpci (n=6 each), 7 dpci (n=5 each) and 12 dpci (n=6 each). Graphs represent the percentage ratio of DsRed+/EdU+ CMs to the total number of DsRed+ CMs. (C) Percentage of non-CM proliferation quantified in whole-mount ccn2a+/+, ccn2a+/− and ccn2a−/− hearts at 7 dpci (n=3). The graph represents the ratio of EdU+/DAPI+ nuclei to the total number DAPI+ nuclei in the injured tissue. The mean wild-type control value was set to 100%. (D) Maximum intensity projections of confocal images of a 10 µm ventricular sagittal cryosection stained for EdU (yellow) and with DAPI (white; marks all nuclei). DsRed marks CM nuclei; arrowheads indicate EdU+/DsRed+ cells. Dotted lines indicate the injury border. (E) The percentage of proliferating CMs in the border zone (up to 100 µm away from the injury border) was quantified in ccn2a+/+ and ccn2a−/− hearts at 7 dpci (n=6). At least two sections from each heart were analyzed. Data are mean±s.e.m. in B and E, and mean±s.d. in C. The statistical significance of differences was evaluated using Mann–Whitney nonparametric tests (GraphPad Prism). |