
Fig. 3
- ID
- ZDB-FIG-210303-90
- Publication
- Mukherjee et al., 2020 - Ccn2a/Ctgfa is an injury-induced matricellular factor that promotes cardiac regeneration in zebrafish
- Other Figures
- All Figure Page
- Back to All Figure Page
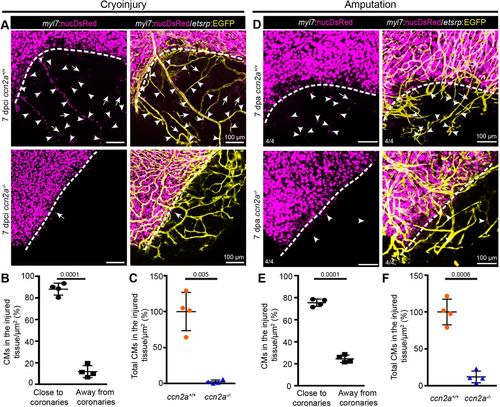
Cardiomyocyte tracking along new coronary vessels into injured tissue fails in ccn2a mutants. (A) Maximum intensity projections of confocal images of freshly isolated whole-mount heart evaluated for coronary angiogenesis and CM tracking along the new coronary vessels into the injured tissue. DsRed expression marks CM nuclei (magenta); EGFP expression marks coronary vessels (yellow). Arrowheads and arrows indicate CMs along and distant from new coronary vessels in the injured tissue, respectively. Dotted lines indicate the injury border. (B) Analysis of the percentage of the total infiltrated CMs observed along and distant from coronary vessels in the injured tissue quantified in wild-type whole-mount hearts (n=4). The total number of infiltrated CMs in the injured tissue of each sample was considered as 100%. (C) A comparison of the total infiltrated CMs in wild-type and ccn2a mutant whole-mount hearts at 7 dpci (n=4). The average for wild type was considered to be 100%. Data are mean±s.d. (D) Representative maximum intensity projections of confocal images of whole-mount heart freshly isolated at 7 dpa. DsRed marks CM nuclei; EGFP marks coronary vessels. Arrowheads and arrows indicate CMs residing along and distant from, respectively, new coronary vessels in the wound. Dotted lines indicate the wound border. (E) Analysis of the percentage of the total infiltrated CMs seen along and distant from coronary vessels in the injured tissue quantified in whole-mount wild-type hearts (n=4). Total number of CMs in the injured tissue of each sample was considered to be 100%. (F) A comparison of the total number of CMs in the injured tissue of wild-type and ccn2a mutant whole-mount hearts at 7 dpa. The average for wild type (n=4) was considered to be 100%. Data are mean±s.d. The statistical significance of differences was evaluated by a two-tailed Student's t-test (GraphPad Prism). Thickness of maximum intensity projections: 30 to 40 µm. |