Fig. 1
- ID
- ZDB-FIG-210302-14
- Publication
- Banerjee et al., 2021 - An assistive computer vision tool to automatically detect changes in fish behavior in response to ambient odor
- Other Figures
- All Figure Page
- Back to All Figure Page
|
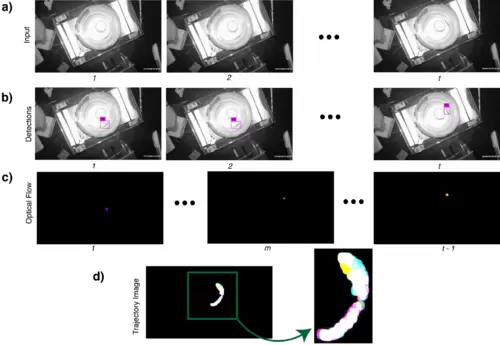
Process used to generate a trajectory image from experimental data. This figure illustrates the first two steps, fish detection and tracking, of the software pipeline that forms the proposed tool. The process includes (a) Selection of raw input video frames; (b) automatic detection of a fish within each video frame; (c) tracking of the fish via optical flow; (d) creation of a trajectory image combining the optical flow output of the video frames, which is provided to an autoencoder for compression. We use the latent representation from the autoencoder for classification. That process is shown in Fig. 2. The numbers 1,2,…,𝑡 just beneath the images stand for different timestamps of the video frames. Since the optical flow algorithm operates on two consecutive frames, the total number of frames after processing by the algorithm is 𝑡−1. |

