FIGURE SUMMARY
Title

An assistive computer vision tool to automatically detect changes in fish behavior in response to ambient odor

Authors
Banerjee, S., Alvey, L., Brown, P., Yue, S., Li, L., Scheirer, W.J.
Source
Full text @ Sci. Rep.

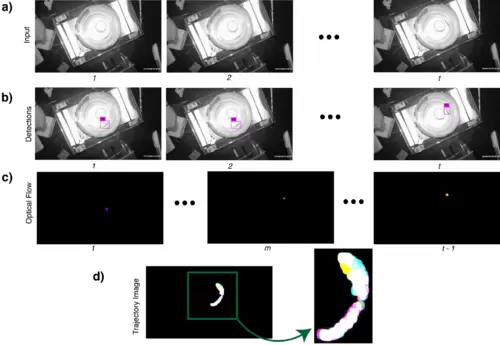
Process used to generate a trajectory image from experimental data. This figure illustrates the first two steps, fish detection and tracking, of the software pipeline that forms the proposed tool. The process includes (a) Selection of raw input video frames; (b) automatic detection of a fish within each video frame; (c) tracking of the fish via optical flow; (d) creation of a trajectory image combining the optical flow output of the video frames, which is provided to an autoencoder for compression. We use the latent representation from the autoencoder for classification. That process is shown in Fig. 2. The numbers 1,2,โ€ฆ,๐‘ก just beneath the images stand for different timestamps of the video frames. Since the optical flow algorithm operates on two consecutive frames, the total number of frames after processing by the algorithm is ๐‘กโˆ’1.

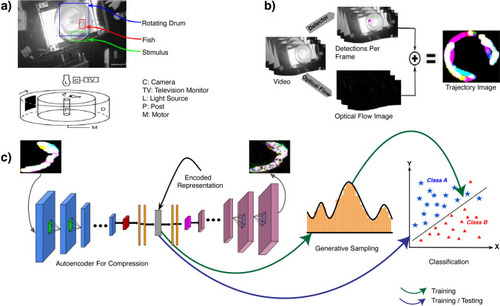
An overview of the behavioral experiments and tool to analyze them. (a) Experimental setup for recording behavioral visual sensitivity in zebrafish in response to olfactory and TN stimulation. The drum rotation in the lower diagram is clockwise, and the direction of the swimming fish is initially counterclockwise. The fish displayed escape responses to the approach of the black segment. Upon the black segment coming into view, a fish will immediately turn and swim away (in the clockwise direction in this example). Abbreviations used in the lower diagram: C, camera; D, rotating drum; L, light source; M, motor; P, post; TV, television monitor. (b) The process for generating trajectory images for zebrafish from videos. This shows how the first two steps of the overall pipeline (see Fig. 1) are combined to form a trajectory image. We use automatically detected regions of interest to create a mask for the fish such that only the pixels representing the fish in the tank are illuminated for dense optical flow estimation. All the frames are combined thereafter to generate a single trajectory image for the entire video. (c) Data compression using autoencoders, generative sampling and a binary classifier for behavior analysis for fish. This shows how the remaining three steps of the overall pipeline fit together. Since the raw features from the trajectory images can be high-dimensional, we use compression via autoencoders to limit the dimensionality of trajectory images. The encoded representations can be used as-is for classifier training and testing, or as priors for generative sampling before training a classifier.

Acknowledgments
This image is the copyrighted work of the attributed author or publisher, and ZFIN has permission only to display this image to its users. Additional permissions should be obtained from the applicable author or publisher of the image. Full text @ Sci. Rep.