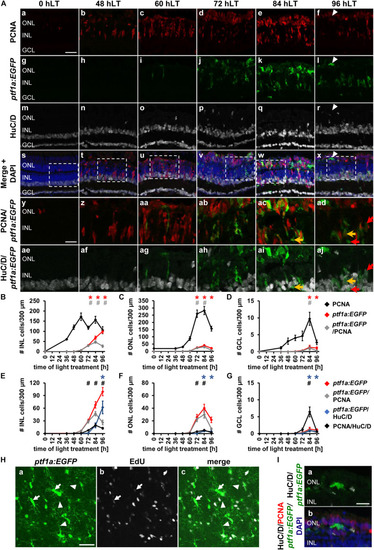
Amacrine and horizontal cell competence factor ptf1a is upregulated in the light-damaged retina. (Aa–aj) Single z-plane confocal images of retinal sections from light-damaged Tg[ptf1a:EGFP]jh1 zebrafish (0, 48, 60, 72, 84, 96 hLT) immunolabeled for PCNA (Aa–f,As–ad), GFP (Ag–l,As–aj), HuC/D (Am–x,Aae–aj) and counterstained with DAPI (As–x). (Ay–aj) Regions outlined in panels (As–x) at higher magnification. Arrowhead, ptf1a:EGFP-positive ONL cell with an elongated morphology. Yellow arrows, ptf1a:EGFP, PCNA and HuC/D-triple positive cell. Red arrows, ptf1a:EGFP and HuC/D-double positive cell that is PCNA-negative. (B–D) Number of PCNA-positive, ptf1a:EGFP-positive and PCNA and ptf1a:EGFP-double positive cells in the INL (B), ONL (C), and GCL (D) over the light treatment timecourse. (E–G) Number of ptf1a:EGFP-positive, ptf1a:EGFP and PCNA−double positive cells in comparison to ptf1a:EGFP and HuC/D-double positive and PCNA and HuC/D-double positive cells in the INL (E), ONL (F), and GCL (G) of retinas exposed to constant intense light for 0, 36, 48, 60, 72, 84 and 96 h. Mean ± SE, n ≥ 10, *pTukey < 0.05 and #p < 0.05 indicate comparisons to 0 hLT for the different measures that were assessed. The symbols are color-coded according to the line that they represent in the corresponding graphs (pANOVA, see Table 1). Note, significance was not determined for PCNA in panels (B–D) and symbols indicating significance for ptf1a:EGFP and ptf1a:EGFP and PCNA-double-positive cells are not shown in panels (E-G), as they are indicated in panels (B–D). (Ha–c) Maximum projections of five confocal z-sections at the level of the inner plexiform/amacrine cell layer in light-damaged Tg[ptf1a:EGFP]jh1 dorsal retinal flatmounts at 96 hLT. Newly generated ptf1a:EGFP-positive amacrine cells (Ha,c) identified by EdU [(Hb,c); arrows], which was intraperitoneally injected during the proliferative phase, display neurite outgrowth (arrowheads). The images are representative of three independent experiments. (I) Higher magnification confocal images of the horizontally elongated ptf1a:EGFP-positive ONL cell at 96 hLT in panel (Al) (arrowhead), which potentially represents a newly generated horizontal cell. Confocal images also display HuC/D (Ia,b), PCNA (Ib) and DAPI (Ib). Scale bars, 20 μm (Aa, Ha) and 10 μm (Ay, Ia).
|
