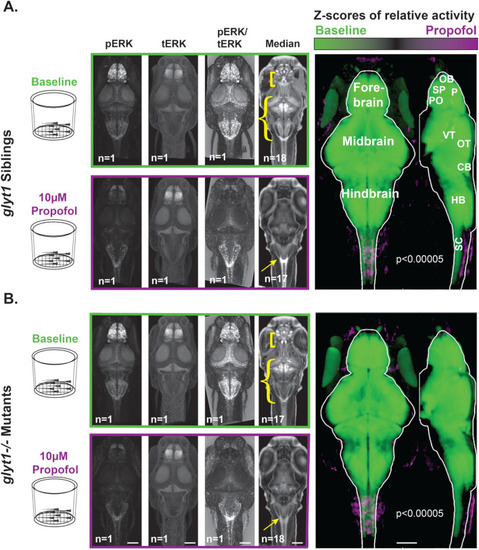
Brain-wide activity in both glyt1−/− mutants and wild type siblings is significantly reduced by exposure to propofol. Four batches of sixteen to eighteen, six-day-old larvae were placed in baskets (diagramed to the left) to enable easy transfer of larvae from system water to 10 µM propofol solutions. Half contained glyt1 siblings (A) and the other half glyt1−/− mutants (B). Larvae from each treatment were fixed and stained with pERK and tERK antibodies and z-stacks of the brain were captured on a confocal microscope. Images boxed in green correspond to baseline conditions while images boxed in purple correspond to exposure to 10 µM propofol for twenty minutes. Images show standard deviation projections of pERK, tERK, pERK/tERK, and median values. To compare activity between baseline and propofol treatments, voxels with more intense pERK/tERK at a p < 0.00005 threshold under baseline conditions are shown in green while voxels with more intense pERK/tERK in propofol are shown in purple for glyt1 siblings (A) and glyt1−/− mutants in (B). It is clear that both glyt1 siblings and glyt1−/− mutants have reduced activity at anesthetic doses of propofol as expected from their similar dose/response curves. Yellow brackets, curly brackets and arrows in median images highlight staining patterns that differ significantly between glyt1−/− mutants and their siblings. Under Baseline conditions, brackets point to a region encompassing the subpallium and preoptic that has more pronounced staining in the glyt1−/− mutants while curly brackets point to a region encompassing the optic tectum, cerebellum, and hindbrain that has more intense staining in the glyt1 siblings. Under propofol, arrows point to the area postrema region of the hindbrain that has more pronounced staining in glyt1 siblings. CB cerebellum, HB hindbrain, OB olfactory bulb, OT optic tectum, P pallium, PO preoptic, SC Spinal Cord, SP Sub-pallium, VT ventral tegmentum. Scale bars = 100 µm.
|
