
Fig. 4
- ID
- ZDB-FIG-210204-4
- Publication
- Jones et al., 2020 - A multiorganism pipeline for antiseizure drug discovery: Identification of chlorothymol as a novel γ-aminobutyric acidergic anticonvulsant
- Other Figures
- All Figure Page
- Back to All Figure Page
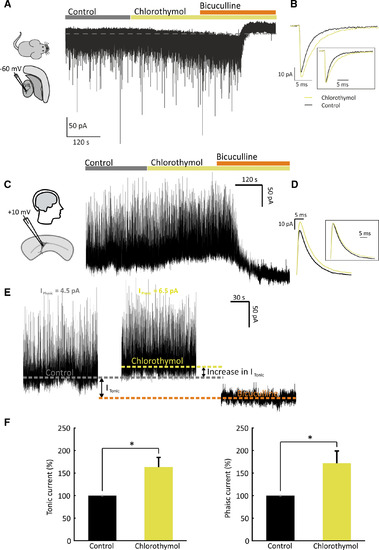
Chlorothymol increases tonic and phasic γ‐aminobutyric acidergic currents in mouse and human brain slices. A, Example whole‐cell recording from a mouse thalamic ventrobasal (VB) neuron. Inhibitory currents were isolated by holding the cell at −60 mV in voltage clamp mode in the presence of 2 mmol·L–1 kynurenic acid and 0.5 μmol·L–1 tetrodotoxin. Bath application of 54 µmol·L–1 chlorothymol induced an inward shift in the holding current, consistent with an enhancement of the resident tonic inhibitory conductance (revealed by subsequent application of 30 μmol·L–1 bicuculline). B, Superimposed miniature inhibitory postsynaptic current (mIPSC) averages obtained before and after chlorothymol application (from the same cell shown in A). The boxed inset illustrates the averaged chlorothymol current normalized to the control peak amplitude. C, Example whole‐cell recording from a human cortical neuron. Inhibitory currents were isolated by holding the cell at +10 mV in voltage clamp mode. Chlorothymol (54 µmol·L–1) and bicuculline (10 µmol·L–1) were sequentially applied to test their effects on inhibitory currents. D, Superimposed mIPSC averages obtained before and after chlorothymol application (from the cell shown in C). The boxed inset shows averaged chlorothymol current normalized to the control peak amplitude. E, Expanded timepoints from the recording in C under control, chlorothymol, and bicuculline conditions. Colored dotted lines represent the holding current under these three conditions. Bicuculline blocks both phasic (Iphasic) and tonic (Itonic) currents and hence can be used to calculate Itonic in control conditions as the difference between the holding current under control and bicuculline conditions. The increase in Itonic induced by chlorothymol was calculated as the difference in holding current between chlorothymol and control. Iphasic was calculated by averaging the traces after subtraction of the holding current (see Materials and Methods for full details). F, Population data showing that chlorothymol increased both Itonic and Iphasic in human cortical neurons. Data are shown as mean ± SEM (n = 6 brain slices) and were analyzed by paired t tests (*P < .05) |