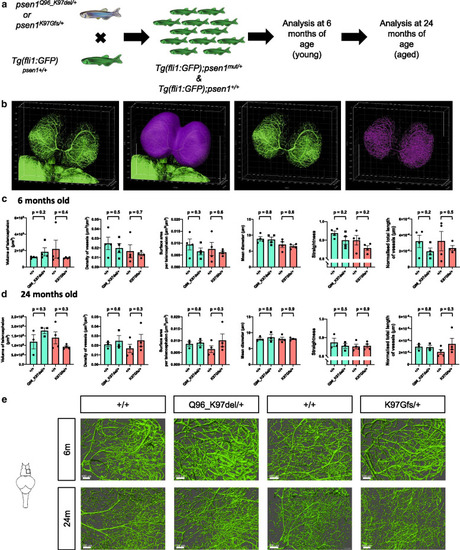
No statistically significant changes to brain vascular network parameters due to heterozygosity for the Q96_K97del or K97Gfs mutations of psen1. a Experimental design flow diagram. Genome-edited psen1 heterozygous mutant fish were pair-mated with transgenic zebrafish expressing green fluorescent protein (GFP) under the control of the fli1 promotor (fli1:GFP transgene). GFP-fluorescent larvae were selected to give a family of transgenic siblings either wild type or heterozygous for a psen1 mutation. Analysis of the brain vascular network was performed at 6 and 24 months of age. b 3D image analysis pipeline. The telencephalon was manually segmented from the optic tectum using contour lines to generate a masked surface channel containing only GFP signals from the telencephalon. Then, an additional surface was generated over the vessels to remove background fluorescence. A masked surface channel was generated from this surface as input for the filament trace algorithm. c Measured values from the surface and filament trace algorithms for the 6 month old zebrafish and d the 24 month old female zebrafish for (left to right) the volume of the telencephalon, the density of fli1:GFP positive vessels per telencephalon, the surface area of vessels normalised to the volume of the telencephalon, the overall mean diameter of vessels, the overall straightness of the vessels, and the total length of the vessels normalised to the volume of the telencephalon. Data are presented as the mean ± standard deviation. Colours of the bars represent the two families of fish used in this analysis. P-values were determined by Student’s t-test assuming unequal variance. e Representative images of a 200 µm section of the right hemisphere of the telencephalon from fish of each age and genotype. Scale bars indicate 100 µm. Vessels appeared morphologically similar in each age and genotype
|
