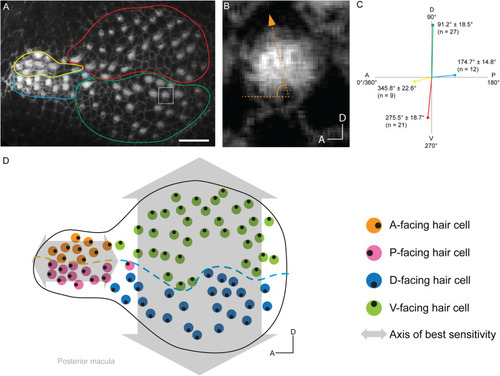
Map of hair bundle polarities in the posterior macula of a 7-dpf larva. (A) Confocal image of a single posterior macula labeled with phalloidin. Circumscribed regions contain groups of hair cells with particular hair bundle polarities: yellow – anterior, blue – posterior, red – ventral, and green – dorsal. (B) Enlarged view of a hair bundle in square in panel (A). The hair bundles angle of deviation from the A-P axis is depicted. (C) Posterior macula hair bundle polarities and associated hair cell numbers. Each colored line length represents the number of hair cells with that orientation in each group from panel (A). Each line orientation is the mean deviation from the A-P axis ± SD. (D) Map of hair bundle polarities in the posterior macula from panel (A). Each color circle represents an individual hair cell, and the black dot within represents the position of the kinocilium, which reflects bundle polarity. Lines of polarity reversal are shown in the bulbus (blue dashed line) and narrow region (yellow dashed line) for D-V-facing and A-P-facing hair cells, respectively. Axes of best sensitivity are depicted by gray arrows.
|
