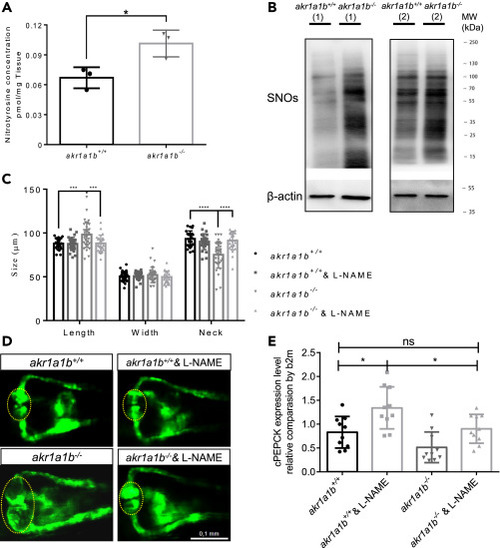
Figure 7NO-Dependent S-Nitrosylation Regulated Gluconeogenesis and Pronephros Development in akr1a1b−/− Mutants (A) Nitrotyrosine was measured by ultrahigh-performance liquid chromatography-mass spectrometry, and was increased in 96-hpf Δ-23 akr1a1b-/- larvae (n = 3 clutches with 50 larvae, mean ± SD). (B) Western blots show increased S-nitrosylated proteins (SNOs) in adult Δ-23 akr1a1b-/- kidneys (n = 2). (C) Inhibition of NO-dependent S-nitrosylation by L-NAME in Δ+17 akr1a1b-/- zebrafish 48-hpf embryos rescued the altered pronephros (n = 27 in akr1a1b+/+ group; n = 27 in akr1a1b+/+ & L-NAME group; n = 34 in akr1a1b-/- group; n = 25 in akr1a1b-/- & L-NAME group, mean ± SD). (D) Representative pronephros images of 48hpf akr1a1b+/+ and Δ+17 akr1a1b-/- embryos treated with L-NAME. Glomeruli are encircled. (E) cPEPCK expression was regulated by S-nitrosylation. Inhibition of S-nitrosylation by L-NAME treatment increased cPEPCK expression in akr1a1b+/+ and Δ-23 akr1a1b-/- encircled larvae at 96 hpf and normalized cPEPCK expression in akr1a1b-/- encircled larvae as measured by RT-qPCR (n = 10 in all groups, mean ± SD). ∗p < 0.05, ∗∗∗p < 0.001, ∗∗∗∗p < 0.0001, p value in (A) was calculated by t test, p values of (C and E) were calculated by one-way ANOVA. Scale bar, 0.1 mm.
|
