FIGURE

Figure 6

ID
ZDB-FIG-210128-119
Publication
Fish et al., 2021 - Venous Thrombosis and Thrombocyte Activity in Zebrafish Models of Quantitative and Qualitative Fibrinogen Disorders
Other Figures
All Figure Page
Back to All Figure Page
Figure 6

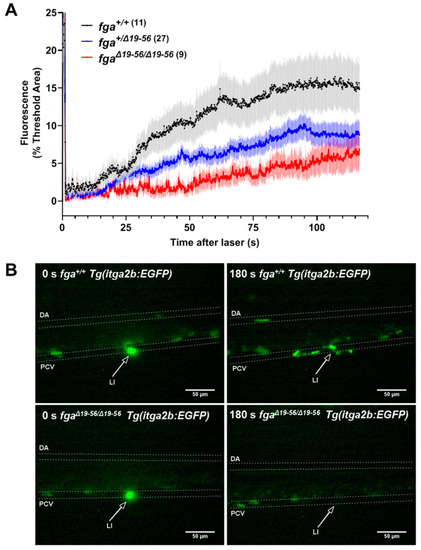
Thrombocyte adhesion and aggregation in a hypodysfibrinogenemia model. (A) Fluorescent thrombocyte binding and adhesion in 5 dpf Tg(itga2b:EGFP) embryos after laser injury of the PCV over time in fga+/+, fga+/Δ19–56 and fgaΔ19–56/Δ19–56 genotypes. Each line represents the mean (+/−SEM) of thrombocyte fluorescence reaching a threshold fluorescence within a defined area. (B) Time lapse images of fga+/+ and fgaΔ19–56/Δ19–56 larvae upon (0 s) and 180 s after laser injury. Fluorescence from the laser is seen at 0 s and where green fluorescent thrombocytes accumulate at 180 s. The dorsal aorta (DA), posterior cardinal vein (PCV) and site of laser injury (LI, arrows) are indicated.

Expression Data
Gene:
Fish:
Condition:
Anatomical Term:
Stage: Day 5

Expression Detail
Antibody Labeling
Phenotype Data
Fish:
Condition:
Observed In:
Stage: Day 5

Phenotype Detail
Acknowledgments
This image is the copyrighted work of the attributed author or publisher, and ZFIN has permission only to display this image to its users. Additional permissions should be obtained from the applicable author or publisher of the image. Full text @ Int. J. Mol. Sci.