
FIGURE
Figure 1
- ID
- ZDB-FIG-210128-114
- Publication
- Fish et al., 2021 - Venous Thrombosis and Thrombocyte Activity in Zebrafish Models of Quantitative and Qualitative Fibrinogen Disorders
- Other Figures
- All Figure Page
- Back to All Figure Page
Figure 1
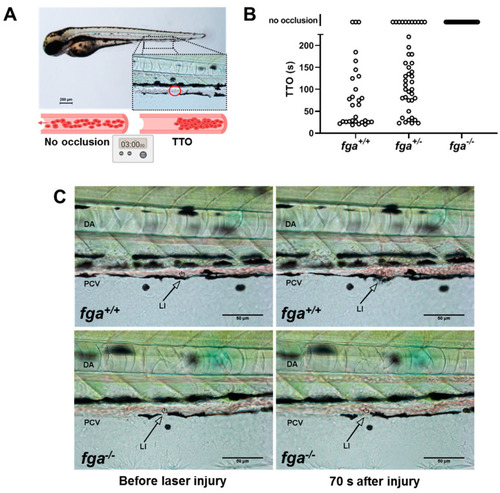
Laser-induced venous thrombosis in an afibrinogenemia model. (A) Diagram of time-to-occlusion (TTO) assay. The posterior caudal vein (PCV) is targeted for laser injury (region represented by the red circle) near the 5th somite distal to the cloaca and the time to PCV occlusion measured. A 3-min cut-off is used to determine no occlusion. (B) TTO in seconds (s) in 3 dpf fga+/+, fga+/− and fga−/− larvae. Each circle represents an individual larva. (C) Time lapse images of 3 dpf fga+/+ and fga−/− larvae before and after laser injury at the position marked (LI). DA is the dorsal aorta. |
Expression Data
Expression Detail
Antibody Labeling
Phenotype Data
| Fish: | |
|---|---|
| Condition: | |
| Observed In: | |
| Stage: | Protruding-mouth |
Phenotype Detail
Acknowledgments
This image is the copyrighted work of the attributed author or publisher, and
ZFIN has permission only to display this image to its users.
Additional permissions should be obtained from the applicable author or publisher of the image.
Full text @ Int. J. Mol. Sci.