FIGURE

Figure 4

ID
ZDB-FIG-210117-45
Publication
de Latouliere et al., 2021 - MITO-Luc/GFP zebrafish model to assess spatial and temporal evolution of cell proliferation in vivo
Other Figures
All Figure Page
Back to All Figure Page
Figure 4

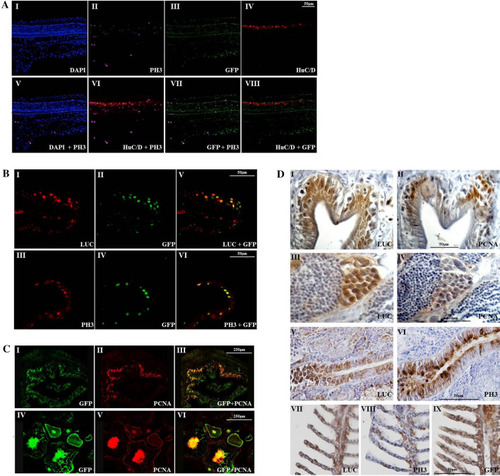
Proliferation markers colocalize with GFP and luciferase proteins in MITO-Luc/GFP zebrafish tissues. (A) Immunofluorescence analysis of DAPI (I), pH3 (II), GFP (III), HuC/D(IV), DAPI-pH3 merge (V), pH3-HuC/D merge (VI), pH3-GFP merge (VII) and GFP-HuC/D merge (VIII) in the trunk region of 24 hpf whole-mount transgenic embryos. (B) Immunofluorescence analysis of luciferase (I), GFP (II, IV), pH3 (III), luciferase-GFP merge (V) and pH3-GFP merge (IV) in adult epidermal tissue. (C) Immunofluorescence analysis of GFP (I,IV), PCNA (II,V), GFP-PCNA merge (III,VI), in intestine (I,II,III) and ovary (IV,V,VI). (D) Immunohistochemical analysis of luciferase (I, III, V, VII), PCNA (II, IV), pH3 (VI, VIII) and GFP (IX) in adult intestine (I, II), testes (III, IV), kidney (V, VI) and gills (VII, VIII, IX). In all tissue analyzed, cells expressing proliferation markers, either PCNA or pH3, show immunoreactivity for luciferase and/or GFP.

Expression Data

Expression Detail
Antibody Labeling
Phenotype Data

Phenotype Detail
Acknowledgments
This image is the copyrighted work of the attributed author or publisher, and ZFIN has permission only to display this image to its users. Additional permissions should be obtained from the applicable author or publisher of the image. Full text @ Sci. Rep.