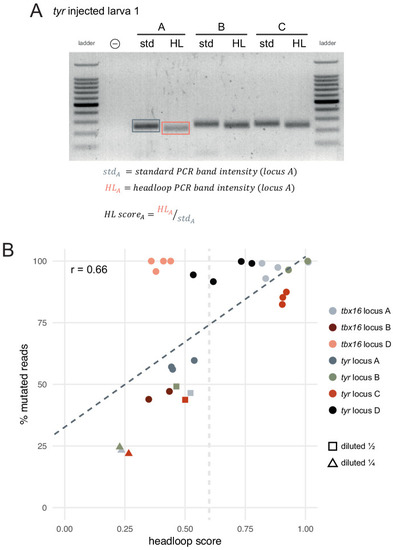
Figure 3—figure supplement 1.

Headloop PCR score can predict the proportion of mutated alleles.

(A) The headloop score (HL score) for a given sample (here, tyr locus A larva 1) was calculated as the ratio between the headloop PCR band intensity (HL) and the standard PCR band intensity (std). As the standard PCR band intensity represents the sum of wild-type and mutated alleles, and the headloop PCR band intensity represents the mutated alleles only, the ratio approximates the proportion of mutated alleles in the sample. (B) Percentage of mutated reads (deep sequencing) as a function of headloop score. Each data point corresponds to one targeted locus in one F0 knockout animal. Some samples were artificially created to simulate mediocre gRNAs by mixing genomic DNA from an injected embryo with genomic DNA from the uninjected control in a 1:1 (diluted ½, squares) or 1:3 ratio (diluted ¼, triangles). For these, the percentage of mutated reads was not measured by deep sequencing but estimated by dividing the percentage of mutated reads of the original sample by 2 (diluted ½) or 4 (diluted ¼). The dark grey dashed line is the line of best fit by linear regression: proportion of mutated reads = 0.33 + 0.69 × headloop score; R2 = 0.44. Headloop score is a significant predictor of the proportion of mutated reads, p < 0.001 (linear regression); r = 0.66 (Pearson). The light grey dashed vertical line indicates a tentative threshold at headloop score 0.6 to discriminate mediocre gRNAs. Two tbx16 locus B samples were excluded because they appeared degraded on the agarose gel. n = 29 samples; each data point is the mean of at least three technical replicates.

Expression Data

Expression Detail
Antibody Labeling
Phenotype Data

Phenotype Detail
Acknowledgments
This image is the copyrighted work of the attributed author or publisher, and ZFIN has permission only to display this image to its users. Additional permissions should be obtained from the applicable author or publisher of the image. Full text @ Elife