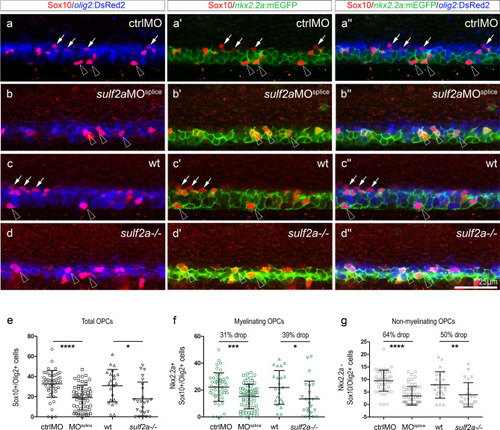
Sulf2a depletion causes a preferential deficit of non-myelinating OPCs. Side views of 48 hpf embryos. (a–d”) Immunodetection of Sox10 in Tg(nkx2.2a:mEGFP; olig2:DsRed2) embryos injected with ctrlMO (a–a”) or sulf2aMOsplice (b–b”) and wild-type (c–c”) or mutant for sulf2a (d–d”). Horizontal sets present successively the Sox10 staining (red) in combination with the olig2:DsRed2 signal (blue, a–d), with the nkx2.2a:mEGFP signal (green, a’–d’) and the merged image of the three signals (a”–d”). White arrows point to non-myelinating OPCs (Nkx2.2a:mEGFP-/olig2:DsRed2 + /Sox10 + cells) while open arrowheads indicate myelinating OPCs (Nkx2.2a:mEGFP + /olig2:DsRed2 + /Sox10 + cells). (e–g) Quantification of OPCs in embryos injected with ctrlMO (n = 70) or sulf2aMOsplice (n = 59) and in wild-type (n = 23) or sulf2a−/− (n = 24) embryos from five and three independent experiments, respectively. Cell counts in (e) correspond to the total number of OPCs co-expressing Sox10 and olig2:DsRed2. Quantifications of nkx2.2a:mEGFP + /myelinating OPCs (f) and nkx2.2a:mEGFP-/non-myelinating OPCs (g) were presented separately. Datasets were compared with Mann Whitney’s test (two-tailed). Data are presented as mean number of cells per embryo ± s.d (*p < 0.05, **p < 0.01, *** p < 0.0005, ****p < 0.0001).
|
