
Fig. 4
- ID
- ZDB-FIG-210112-7
- Publication
- Giarmarco et al., 2020 - Daily mitochondrial dynamics in cone photoreceptors
- Other Figures
- All Figure Page
- Back to All Figure Page
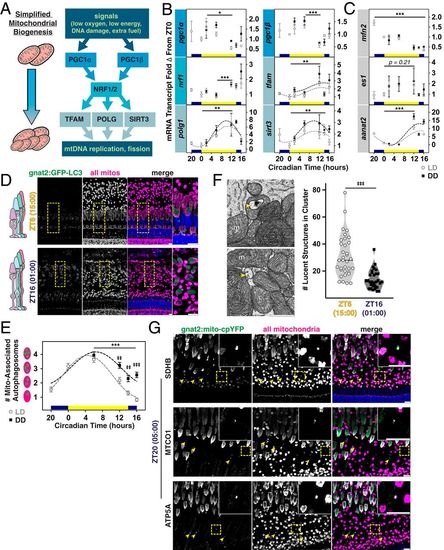
Mitogenesis genes peak in the evening, when fewer autophagosomes associate with mitochondrial clusters. (A) Simplified pathway for mitogenesis. (B and C) Quantification of mRNA transcripts from whole retinas measured using qPCR: in B, six mitogenesis genes, and in C, the mitochondrial fusion factor mfn2, the mitochondrial enlargement factor es1, and a control gene aanat2. LD, open circles; DD, black squares. *P < 0.05. **P < 0.01. ***P < 0.0001. (D) IHC images of transgenic zebrafish outer retina expressing cone-targeted GFP-LC3 (green) overlaid with mitochondrial and nuclear stains (magenta and blue, respectively) at ZT6 and ZT16. Yellow boxes, zoomed-in areas. (Scale bars, 10 µm.) (E) Quantification of mitochondrial LC3-positive puncta in blue and UV cones from IHC for LD or DD groups. ‡‡P < 0.001. ***,‡‡‡P < 0.0001. (F, Left) SEM images of lucent autophagosomal structures (yellow arrowheads) inside and between cone mitochondria (m). (Scale bar, 1 µm.) (F, Right) Violin plots quantifying lucent structures in clusters at ZT6 (empty circles) and ZT16 (black squares); lines represent median. ‡‡‡P < 0.0001. (G) IHC images of transgenic cone-targeted mito-cpYFP (green) counterstained for SDHB, MTCO1, or ATP5A (magenta) and nuclei (blue) at 05:00 (ZT20). Yellow arrowheads and Insets indicate mislocalized mitochondria. (Scale bars, 10 µm.) SI Appendix, Table S2 lists statistical information and Ns from all groups. |