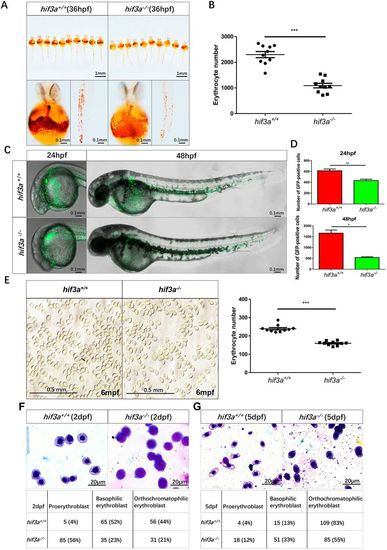
The number of erythrocytes is reduced and primitive erythroid maturation is retarded in hif3a−/−. (A) O-Dianisidine staining of functional hemoglobin in the mature primitive erythrocytes in hif3a+/+ (left) and hif3a−/− (right) at 36 hpf. The experiments were repeated three times. (B) The number of erythrocytes was reduced in hif3a−/− (10 larvae). (C) Fluorescent images of Tg(gata1:eGFP)/hif3a+/+ (top) and Tg(gata1:eGFP)/hif3a−/− (bottom) indicated that hif3a−/− have fewer gata1-positive erythrocytes at 24 hpf and 48 hpf. (D) Quantitation of gata1-positive erythrocytes in Tg(gata1:eGFP)/hif3a+/+ and Tg(gata1:eGFP)/hif3a−/− at 24 hpf (top) and 48 hpf (bottom) (10 larvae for each, three replicates). (E) The number of erythrocytes was significantly reduced in hif3a−/− compared with hif3a+/+ at 6 mpf. Representative image of erythrocytes in the counting chamber (1 mm×1 mm) (right); scatter plot indicates erythrocyte numbers in 10 counting chambers (left). (F,G) Representative images of May–Grunwald–Giemsa-stained erythroblasts in hif3a+/+ and hif3a−/− larvae at 2 dpf (F) and 5 dpf (G). Cells were morphologically classified at various stages of maturation; numbers (and percentages in brackets) of hif3a+/+ and hif3a−/− larvae at each stage are shown. Error bars indicate the s.e.m.; *P<0.05; **P<0.01; ***P<0.001 (unpaired, two-tailed Student's t-test).
|
