
- Title
-
Zebrafish hif-3α modulates erythropoiesis via regulation of gata-1 to facilitate hypoxia tolerance
- Authors
- Cai, X., Zhou, Z., Zhu, J., Liao, Q., Zhang, D., Liu, X., Wang, J., Ouyang, G., Xiao, W.
- Source
- Full text @ Development
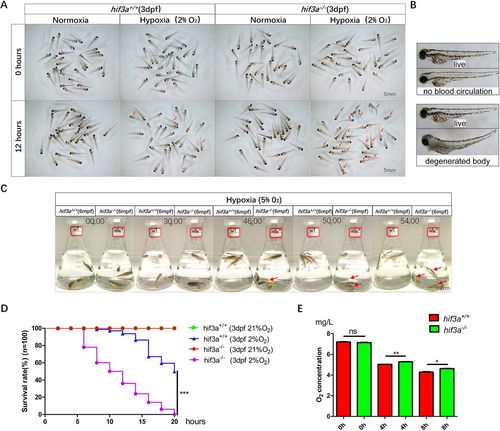
Zebrafish hif3a facilitates hypoxia tolerance. (A) Representative images of hif3a−/− larvae and WT (hif3+/+) larvae (30 larvae for each, 90 larvae in total; 3 dpf), subjected to normoxia (21% O2) or hypoxia (2% O2) for 12 h. The dead larvae (marked by red arrows) exhibited lack of movement, absence of blood circulation and bodily degeneration. (B) Representative images of living and dead zebrafish larvae. (C) Hif3a−/− adults were more sensitive to hypoxia (5% O2) compared with their WT siblings. Survival of hif3a+/+ (left flask) and hif3a−/− (right flask) (6 mpf) after 0 min, 30 min, 46 min, 50 min and 54 min in hypoxic conditions (5% O2) (three zebrafish for each, three replicates). Red arrows indicate dying zebrafish. (D) The survival rate curve of hif3a−/− larvae and their WT siblings. The oxygen concentration of the hypoxia workstation was adjusted to 2% before experimentation. The dead larvae were counted once every two hours (100 larvae). (E) Oxygen consumption rate was lower in hif3a−/− than in their WT siblings (6 mpf). The experiments were repeated at least three times. Error bars indicate s.e.m.; ns, not significant; *P<0.05; **P<0.01; ***P<0.001 (unpaired, two-tailed Student's t-test). PHENOTYPE:
|
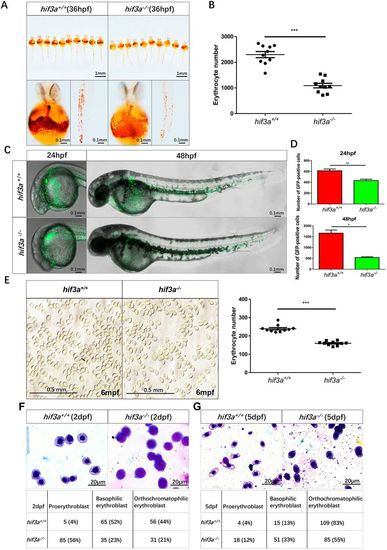
The number of erythrocytes is reduced and primitive erythroid maturation is retarded in hif3a−/−. (A) O-Dianisidine staining of functional hemoglobin in the mature primitive erythrocytes in hif3a+/+ (left) and hif3a−/− (right) at 36 hpf. The experiments were repeated three times. (B) The number of erythrocytes was reduced in hif3a−/− (10 larvae). (C) Fluorescent images of Tg(gata1:eGFP)/hif3a+/+ (top) and Tg(gata1:eGFP)/hif3a−/− (bottom) indicated that hif3a−/− have fewer gata1-positive erythrocytes at 24 hpf and 48 hpf. (D) Quantitation of gata1-positive erythrocytes in Tg(gata1:eGFP)/hif3a+/+ and Tg(gata1:eGFP)/hif3a−/− at 24 hpf (top) and 48 hpf (bottom) (10 larvae for each, three replicates). (E) The number of erythrocytes was significantly reduced in hif3a−/− compared with hif3a+/+ at 6 mpf. Representative image of erythrocytes in the counting chamber (1 mm×1 mm) (right); scatter plot indicates erythrocyte numbers in 10 counting chambers (left). (F,G) Representative images of May–Grunwald–Giemsa-stained erythroblasts in hif3a+/+ and hif3a−/− larvae at 2 dpf (F) and 5 dpf (G). Cells were morphologically classified at various stages of maturation; numbers (and percentages in brackets) of hif3a+/+ and hif3a−/− larvae at each stage are shown. Error bars indicate the s.e.m.; *P<0.05; **P<0.01; ***P<0.001 (unpaired, two-tailed Student's t-test). |
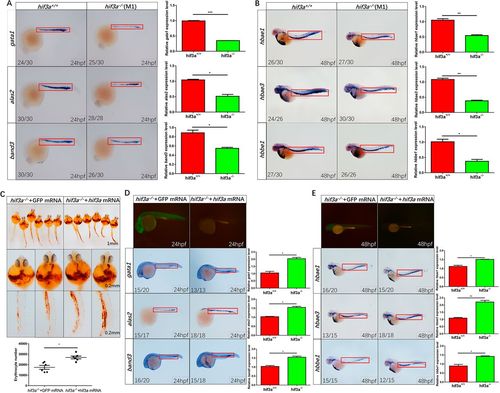
Disruption of hif3a influences expression of hematopoietic marker genes, but ectopic expression of hif3a partially rescues hematopoietic defects exhibited in hif3a−/−. (A) Expression levels of the erythrocytic markers gata1, alas2 and band3 were reduced significantly in hif3a−/− larvae at 24 hpf. Quantitation of the signal in the red rectangle is shown on the right (10 larvae for each, three replicates). (B) Expression levels of the erythrocyte-specific hemoglobin markers hbae1, hbae3 and hbbe1 were reduced in hif3a−/− larvae at 48 hpf. Quantitation of the signal in the red rectangle shown on the right (10 larvae for each, three replicates). (C) O-Dianisidine staining indicated that co-injection of hif3a mRNA partially restored hemoglobin levels in hif3a−/− larvae compared with co-injection of GFP mRNA at 36 hpf. Hif3a and GFP mRNA, 750 pg/embryo. Quantitation showed in the bottom panel (six larvae for each, three replicates). (D) Expression levels of the erythrocytic markers gata1, alas2 and band3 were restored by injection of hif3a mRNA in hif3a−/− embryos as compared to the injection of the GFP mRNA control at 24 hpf. Quantitation of the signal in the red rectangle is shown on the right (10 larvae for each, three replicates). (E) Expression levels of the erythrocytic markers hbae1, hbae3 and hbbe1, were restored by injection of hif3a mRNA in hif3a−/− embryos as compared to the injection of the GFP mRNA control at 48 hpf. Quantitation of the signal in the red rectangle is shown on the right (10 larvae for each, three replicates). The number of stained embryos is indicated in the left lower corner of each representative picture. M1, mutant 1. Error bars indicate the s.e.m.; *P<0.05; **P<0.01; ***P<0.001 (unpaired, two-tailed Student's t-test). |

ZFIN is incorporating published figure images and captions as part of an ongoing project. Figures from some publications have not yet been curated, or are not available for display because of copyright restrictions. |