FIGURE

Figure 2

ID
ZDB-FIG-201229-75
Publication
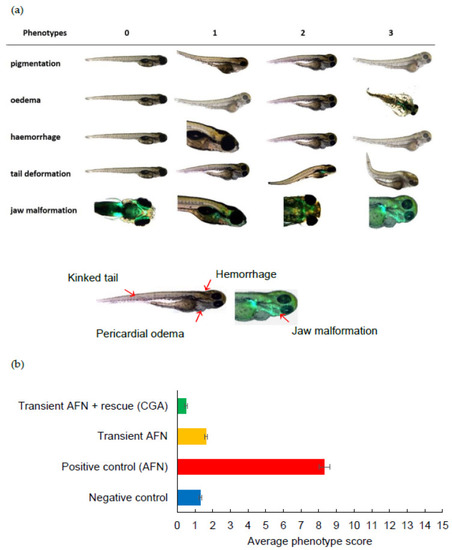
Chiu et al., 2020 - Chlorogenic Acid Supplementation Benefits Zebrafish Embryos Exposed to Auranofin
Other Figures
All Figure Page
Back to All Figure Page
Figure 2

(a) Visual scoring chart for phenotypic abnormalities in zebrafish larvae. Phenotype score 0 = healthy, 1 = mild, 2 = moderate, and 3 = severe malformations. (b) Average score for phenotypic abnormalities observed in zebrafish embryos at 5 dpf transiently exposed to AFN followed by chlorogenic acid supplementation. Data are means ± SEM (n = 84–237). AFN = auranofin and CGA = chlorogenic acid. Groups that do not share the same letter are significantly different (p < 0.05). For statistical analysis, degrees of freedom = 3. Reduced pigmentation (F-value = 586.19; p-value 0.000), oedema (F-value 294.86; p-value 0.000), hemorrhage (F-value = 37.28; p-value 0.000), tail malformation (F-value 44.00; p-value 0.000), jaw malformation (F-value 199.56; p-value 0.000), total malformations (F-value = 393.38; p-value 0.000).

Expression Data

Expression Detail
Antibody Labeling
Phenotype Data

Phenotype Detail
Acknowledgments
This image is the copyrighted work of the attributed author or publisher, and ZFIN has permission only to display this image to its users. Additional permissions should be obtained from the applicable author or publisher of the image. Full text @ Pharmaceutics