|
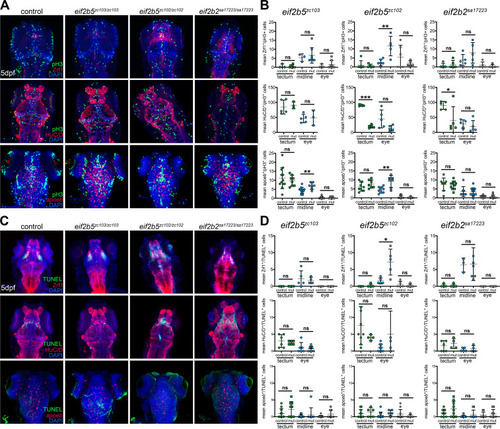
Determination of cell types affected in mutants by changes in proliferation or in apoptosis. (A) Confocal images of brain, z-stack, rostral to the top, in WT, eif2b5zc103/zc103, eif2b5zc102/zc102 or eif2b2sa17223/sa172233 larvae. Confocal images of brain, z-stack, rostral to the top. Top row, labeling for Zrf1, DAPI, and pH3. Middle row, labeling for HuC/D, DAPI, and pH3. Bottom row, labeling for apoeb, DAPI, and pH3. (B) Quantification of cell counts in (A). (C) Confocal images of brain, z-stack, rostral to the top, in WT, eif2b5zc103/zc103, eif2b5zc102/zc102 or eif2b2sa17223/sa172233 larvae. Confocal images of brain, z-stack, rostral to the top. Top row, labeling for Zrf1, DAPI, and TUNEL. Middle row, labeling for HuC/D, DAPI, and TUNEL. Bottom row, labeling for apoeb, DAPI, and TUNEL. (D) Quantification of cell counts in (C).
|