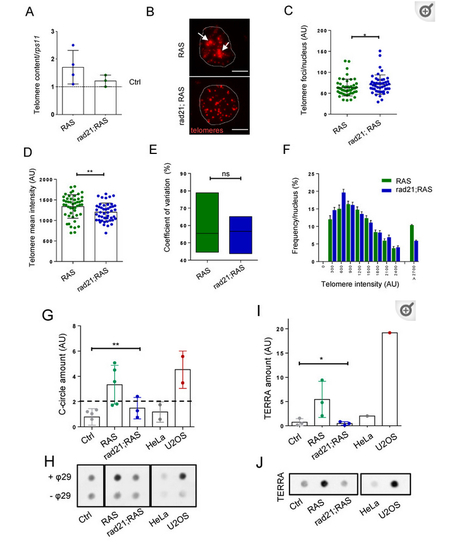
Rad21 depletion prevents ALT, normalize telomere length and reduces TERRA levels in brain tumors. (A) Telomere length analysis through telomeric qPCR in RAS, RAS Rad21 +/− brain tumors compared to control brains (dashed lines). The relative amount was normalized to the signal of a single copy gene (rps11). Each dot represents one sample, n = 3 in all groups. (B) Representative fluorescent microscope images of Q-FISH analysis of RAS and rad21;RAS nuclei with ultrabright foci (white arrows). Scale bar: 5 µm. (C) Quantification of the numbers of telomere foci per nucleus and (D) quantification of relative telomere length intensity measured by Q-FISH in RAS and rad21;RAS brain tumors. * p < 0.05, ** p < 0.01. RAS n = 48 nucleus; rad21;Ras n = 46 nucleus. (E) Analysis of coefficient of variation of telomere mean intensity measured in (C) between RAS and rad21;RAS. (F) Distribution of telomere length evaluated by Q-FISH (C) in RAS and rad21;RAS tumors. The signals >2700 AU could represent ultra-long telomeres or telomeric clusters, an ALT feature. (G) Quantification analysis of C-circle assay dot blots (each dot represents one sample). Determination of C-circles amount was calculated after subtracting global background and specific –θ29 signal. AU: arbitrary unit. (H) Representative C-circle assay followed by telomeric dot blot in control, RAS and rad21;RAS brain tumors compared with telomerase+ HeLa cells and ALT+ U2OS cells. Reactions without phy29 polymerase (–θ29) were included as a control. (I) Quantification of TERRA expression measured by dot blot using total RNA (500 ng) of control, RAS, and rad21;RAS brain tumors. As positive and negative control, U2OS and Hela cells were added. (J) Representative RNA dot blot hybridization using total RNA (500 ng) of control, RAS, and rad21;RAS brain tumors. As positive and negative control, U2OS and Hela cells were added. For (G,I), a minimum of three independent experiments were performed and analyzed with 1 way anova Kruskal–Wallis—non-parametric test.
|
