FIGURE SUMMARY
Title

Rad21 Haploinsufficiency Prevents ALT-Associated Phenotypes in Zebrafish Brain Tumors

Authors
Idilli, A.I., Pazzi, C., Dal Pozzolo, F., Roccuzzo, M., Mione, M.C.
Source
Full text @ Genes (Basel)

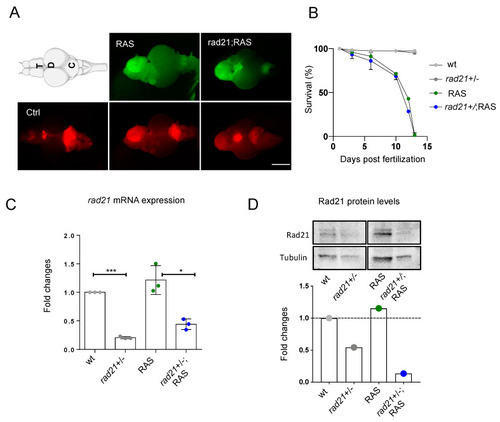
Rad21 heterozygous fish develop brain tumors with the same frequency and location than wt. (A) Representative images of zebrafish RAS and rad21;RAS brains used for this study. The expression of UAS:eGFP-HRASV12 was induced in a population of brain progenitor cells using the driver line zic:GAL4 (visualized through mCherry expression, bottom panel). Tumor formation is visualized through eGFP expression in 1-month-old fish (upper panel). The location of tumors appears to be similar in both RAS and rad21;RAS fish. Scale bar: 0.5 mm. T: telencephalon; OT: optic tectum; C: cerebellum. (B) Survival curve of RAS and rad21;RAS shows a very low survival rate (approx. 1%) for both genotypes n = 2 in control groups (gray dots) and n = 4 in tumor groups (blue and green dots). (C) Expression of zebrafish rad21a mRNA in controls and brain tumors measured by RT-qPCR. Values were normalized to rps11 mRNA levels; n = 3 in all groups; *** p < 0.001; * p < 0.05. (D) Rad21 protein levels in Western blot and relative quantification. Rad21 levels are reduced in control (2nd lane) and tumor brains (4th lane) from rad21ahi2529Tg/+ fish compared to the wild type (fold changes). Values were normalized to tubulin levels.

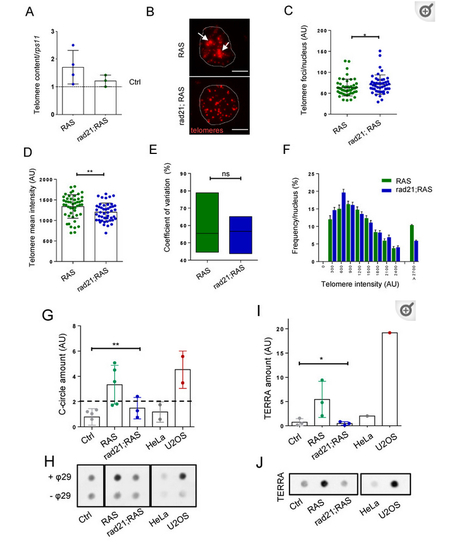
Rad21 depletion prevents ALT, normalize telomere length and reduces TERRA levels in brain tumors. (A) Telomere length analysis through telomeric qPCR in RAS, RAS Rad21 +/− brain tumors compared to control brains (dashed lines). The relative amount was normalized to the signal of a single copy gene (rps11). Each dot represents one sample, n = 3 in all groups. (B) Representative fluorescent microscope images of Q-FISH analysis of RAS and rad21;RAS nuclei with ultrabright foci (white arrows). Scale bar: 5 µm. (C) Quantification of the numbers of telomere foci per nucleus and (D) quantification of relative telomere length intensity measured by Q-FISH in RAS and rad21;RAS brain tumors. * p < 0.05, ** p < 0.01. RAS n = 48 nucleus; rad21;Ras n = 46 nucleus. (E) Analysis of coefficient of variation of telomere mean intensity measured in (C) between RAS and rad21;RAS. (F) Distribution of telomere length evaluated by Q-FISH (C) in RAS and rad21;RAS tumors. The signals >2700 AU could represent ultra-long telomeres or telomeric clusters, an ALT feature. (G) Quantification analysis of C-circle assay dot blots (each dot represents one sample). Determination of C-circles amount was calculated after subtracting global background and specific –θ29 signal. AU: arbitrary unit. (H) Representative C-circle assay followed by telomeric dot blot in control, RAS and rad21;RAS brain tumors compared with telomerase+ HeLa cells and ALT+ U2OS cells. Reactions without phy29 polymerase (–θ29) were included as a control. (I) Quantification of TERRA expression measured by dot blot using total RNA (500 ng) of control, RAS, and rad21;RAS brain tumors. As positive and negative control, U2OS and Hela cells were added. (J) Representative RNA dot blot hybridization using total RNA (500 ng) of control, RAS, and rad21;RAS brain tumors. As positive and negative control, U2OS and Hela cells were added. For (G,I), a minimum of three independent experiments were performed and analyzed with 1 way anova Kruskal–Wallis—non-parametric test.

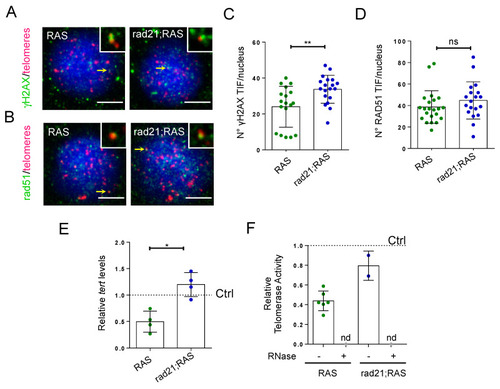
Rad21 depletion increases tert expression and γH2AX TIFs in brain tumors. (A) Representative fluorescent microscope image of Q-FISH and γH2AX immunostaining in RAS and rad21;RAS tumor cells. Scale bar: 5 µm. Insets show examples of co-localization of the Q-FISH and antibody signals, in foci pointed by the yellow arrows. (B) Representative fluorescent microscope image of Q-FISH and Rad51 immunostaining in RAS and rad21;RAS tumor cells. Scale bar: 5 µm. Insets show examples of co-localization of the Q-FISH and antibody signals, in foci pointed by the yellow arrows. (C) Quantification of the numbers of telomere foci which are positive for γH2AX immunostaining (nuclei = 27), also known as TIFs, in RAS and rad21;RAS brain tumors cells. Each dot represents a nucleus. ** p < 0.01. (D) Quantification of the numbers of telomere foci which are positive for rad51 immunostaining (RAS nuclei = 22; rad21;RAS nuclei =19) in in RAS and rad21;RAS brain tumors cells. ns = not significant. Each dot represents a nucleus. (E) Expression of zebrafish tert mRNA in brain tumors measured by RT-qPCR. Values were normalized to rps11 mRNA levels and are relative to tert expression in control brains (dashed line set at 1.0). * p < 0.05. Each dot represents a sample. (F) Relative telomerase activity measured by Q-TRAP in control, RAS, and rad21;RAS brains, using 1 μg of protein extracts. RNase treatment (+) was used as a negative control to confirm the specificity of the assay; each dot represents one sample.

Acknowledgments
This image is the copyrighted work of the attributed author or publisher, and ZFIN has permission only to display this image to its users. Additional permissions should be obtained from the applicable author or publisher of the image. Full text @ Genes (Basel)