
FIGURE 5
- ID
- ZDB-FIG-201202-5
- Publication
- Wang et al., 2020 - Coding Variants Coupled With Rapid Modeling in Zebrafish Implicate Dynein Genes, dnaaf1 and zmynd10, as Adolescent Idiopathic Scoliosis Candidate Genes
- Other Figures
- All Figure Page
- Back to All Figure Page
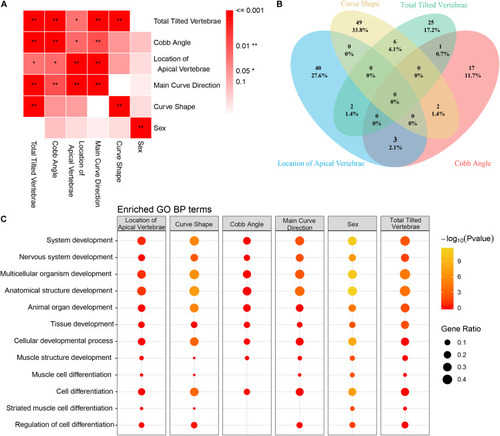
Correlation between clinical features and Gene Ontology (GO) enrichment analysis of clinical feature-related variants. (A) The association between each clinical feature is depicted. The strength of the association is represented by the intensity of the red color. (B) Venn diagram of the distribution of each clinical feature-related variant as identified in our study (blue circle = location of apical vertebrae, yellow circle = Cobb angle, green circle = main curve direction, and pink circle = number of tilted vertebrae). (C) GO enrichment analysis of the filtered variants was performed. GO biological process (BP) annotation is indicated on the left. Each individual box represents a clinical characteristic. The –Log10 ( |