
FIGURE 2
- ID
- ZDB-FIG-201202-2
- Publication
- Wang et al., 2020 - Coding Variants Coupled With Rapid Modeling in Zebrafish Implicate Dynein Genes, dnaaf1 and zmynd10, as Adolescent Idiopathic Scoliosis Candidate Genes
- Other Figures
- All Figure Page
- Back to All Figure Page
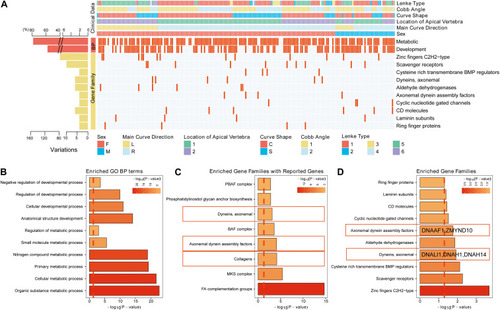
The variants identified from Southern Chinese AIS patients. (A) Genetic variations detected in gene families and related biological processes (BPs). Each row represents an individual gene family or BP category. The altered individuals and frequency of each gene are noted on the left. Each column representing an affected sample with clinical features is indicated by the color key. The occurrence of a variant with gene in corresponding terms across an individual sample is shown by a red (missense variant) or blue (no variant) color scheme. Sex, F = female, M = male. Main curve direction represents the sideness of the major curve, L = left, R = right. Location of the apical vertebra represents the axial location of the apical vertebrae, 1 = T1–T9 vertebrae, 2 = under the T10 vertebra. Curve shape, C = “C”-shaped curve, S = “S”-shaped curves. Cobb angle, 1 = below the mean Cobb angle, 2 = above the mean Cobb angle. Lenke type, 1 = type 1, 2 = type 2, 3 = type 3, 4 = type 4, 5 = type 5, and 6 = type 6. (B) The top 10 enriched Gene Ontology (GO) BP terms in our study. (C) The top enriched gene families with the genes in previous studies or database. (D) The top enriched gene families with the genes reported in our study. |