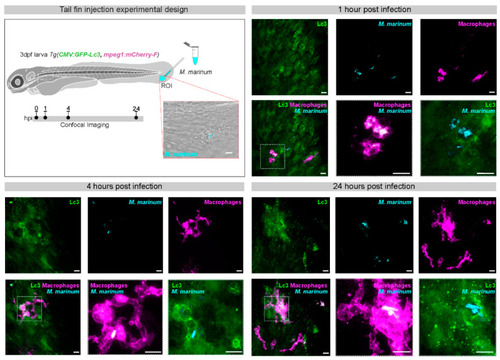
GFP-Lc3 response to M. marinum infection in the tail fin of zebrafish larvae. In the experimental setup of tail fin injections, mCrimson-labeled M. marinum bacteria (200 colony forming units) are microinjected into the tail fin area of zebrafish larvae at 3 days post fertilization (dpf), derived from a double transgenic line that contains a ubiquitously expressed CMV:GFP-Lc3 construct and an mpeg1:mCherry-F construct that labels macrophages. The injection site and region of imaging (ROI) is indicated in the schematic drawing of the larva and a representative bright field and fluorescence overlay image shows the infected area in the tail fin. Confocal laser-scanning microscopy images were acquired 1, 4, and 24 h post infection (hpi). Fluorescent excitation in the range of GFP, far-red and red were used to visualize GFP-Lc3, M. marinum, and macrophages, respectively. At 1 hpi, macrophages are already recruited at the site of infection and phagocytosis of bacteria can be observed. At 4 hpi, GFP-Lc3 signal is observed inside infected macrophages and often appears in ring-shaped patterns. At 24 hpi, the bacterial cluster sizes and numbers are increased, both intra- and extracellularly, which is associated with strong punctate GFP-Lc3 signal in the infected tissue. The boxed areas in the representative images of the different time points are shown in detail on the right. Scale bars: 10 μm.
|
