|
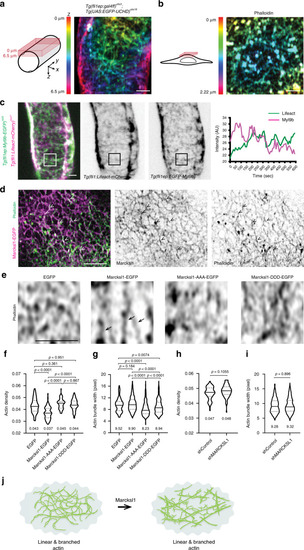
Marcksl1 regulates actin organisation in the endothelial cell cortex.a–c EC cortex contains a dynamic meshwork of actomyosin. Maximum intensity projection of Airyscan images of actin in EC from an ISV of a 2 dpf Tg(fli1ep:GAL4FF)ubs3; Tg(UAS:EGFP-UCHD)ubs18 embryo (a, actin meshwork is observed in 48 out of 63 images from 7 embryos from 5 independent experiments) and the apical cortex of HUVEC stained with Phalloidin (b, 21 cells from 4 independent experiments). Time-lapse imaging of actin and non-muscle myosin II in EC of 2 dpf Tg(fli1:Lifeact-mCherry)ncv7;Tg(fli1ep:EGFP-myl9b)rk25 embryo (c). Lifeact and Myl9b intensity in boxed region was quantified. Dynamic F-actin intensity was observed in 23 ISVs/12 embryos from 5 independent experiments. Dynamic Myl9b intensity was observed in 14 ISVs/6 embryos from 2 independent experiments. d Maximum intensity projection of 2 z-slices from the apical cortex of HUVEC expressing Marcksl1-EGFP and stained with Phalloidin reveals co-localisation of Marcksl1 and actin bundles (arrowheads, 23 cells from 5 independent experiments). e, i Analysis of actin density and bundle width after overexpression of Marcksl1, Marcksl1-AAA and Marcksl1-DDD (e–g) and knockdown of MARCKSL1 (h, i) in HUVECs. Single slice Fast Airyscan images of the apical cortex of HUVEC stained with Phalloidin reveal decreased actin density surrounding actin bundles (arrow) in Marcksl1-EGFP-transfected cells 1 day post transfection (e). f–i Mean values are indicated. Three independent experiments were performed (EGFP, 51 ROIs from 28 cells; Marcksl1-EGFP, 86 ROIs from 29 cells; Marcksl1-AAA-EGFP, 76 ROIs from 28 cells; Marcksl1-DDD-EGFP, 77 ROIs from 32 cells; shControl, 66 ROIs from 24 cells; shMARCKSL1, 74 ROIs from 29 cells). Violin plots represent the entire range of values, dotted lines indicate first and third quartiles, center lines are median. Data was analysed by ordinary one-way ANOVA with Sidak’s multiple comparisons test (f, g) and two-tailed Mann–Whitney test (h, i). j Model illustrating Marcksl1 favours the formation of linear actin bundles at EC cortex. Scale bars, 2 µm (a–e). Source data are provided as a Source data file.
|