|
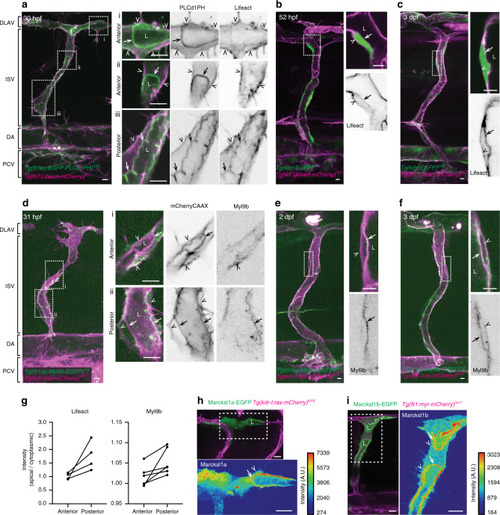
Low actomyosin at endothelial cell apical cortex coincides with lumen expansion.a–f Maximum intensity projection of confocal z-stacks of trunk vessels at different stages of zebrafish development. Cropped images are single-plane images of the z-stack. During lumen expansion of ISVs from 30 to 34 hpf embryos, higher levels of actin (a, Lifeact) and non-muscle myosin II (d, Myl9b) are assembled at the apical cortex of the posterior region of the lumen (iii in a, ii in d) compared to the expanding anterior region of the lumen (i and ii in a, i in d), which contains very little or no actomyosin. At 2 and 3 dpf, distinct actin (b, c) and non-muscle myosin II (e, f) are detected in the apical cortex of fully lumenised vessels. Images are representative of 6 (a, n = 2 independent experiments), 9 (b, n = 5 independent experiments), 7 (c, n = 4 independent experiments), 23 (d, n = 3 independent experiments), 8 (e, n = 3 independent experiments) and 4 (f, n = 2 independent experiments) embryos. g Quantification of apical Lifeact and Myl9b intensity levels in the anterior and posterior segments of the same lumen at 30–34 hpf. Each data pair represents one ISV (Lifeact: n = 4 ISVs from 4 embryos; Myl9b: n = 6 ISVs from 5 embryos). h, i Single-cell expression of Marcksl1a-EGFP in 34 hpf Tg(kdr-l:ras-mCherry)s916 embryo (h, apical enrichment was observed in 5 out of 5 embryos from 3 independent experiments) and Marcksl1b-EGFP in 38 hpf Tg(fli1:myr-mCherry)ncv1 embryo (i, apical enrichment was observed in 20 out of 20 embryos from 6 independent experiments). Arrows, apical cortex; arrowheads, basal cortex; dashed boxes, the magnified regions; DA dorsal aorta; DLAV dorsal longitudinal anastomotic vessel; ISV intersegmental vessel; L lumen; PCV posterior cardinal vein. Scale bars, 5 µm (a–f) and 10 µm (h, i). Source data are provided as a Source data file.
|