
FIGURE
Fig. 3
- ID
- ZDB-FIG-201113-21
- Publication
- Dawes et al., 2020 - Studying molecular interactions in the intact organism: fluorescence correlation spectroscopy in the living zebrafish embryo
- Other Figures
- All Figure Page
- Back to All Figure Page
Fig. 3
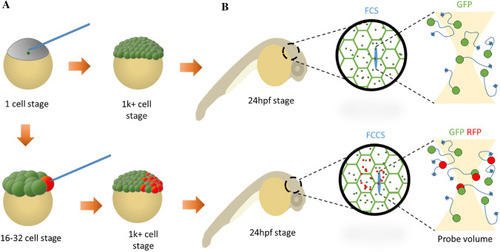
mRNA injection time determines distribution of fluorophore. |
Expression Data
Expression Detail
Antibody Labeling
Phenotype Data
Phenotype Detail
Acknowledgments
This image is the copyrighted work of the attributed author or publisher, and
ZFIN has permission only to display this image to its users.
Additional permissions should be obtained from the applicable author or publisher of the image.
Full text @ Histochem. Cell Biol.