|
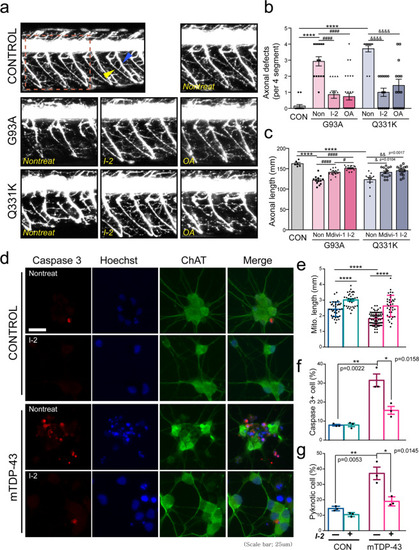
Effects of the suppression of PP1 in ALS-associated zebrafish and human iPS cell models.a Motor axons of zebrafish treated with 200 nM I-2 or 100 nM OA daily for 2 days following transient expression of G93A or Q331K mutations. The red dashed-line square indicates a magnified image of motor axons. The blue arrowhead indicates the ventral projection of the motor axon, and the yellow arrowhead indicates neuromuscular junction. b Analysis of axonal defects in (a). CON = 0.14 ± 0.36 (n = 14 zebrafish), G93A:Non = 2.93 ± 0.29 (n = 14 zebrafish), G93A:I-2 = 0.86 ± 0.23 (n = 14 zebrafish), G93A:OA = 0.73 ± 0.21 (n = 30 zebrafish), Q331K:Non = 3.71 ± 0.19 (n = 14 zebrafish), Q331K:I-2 = 1.00 ± 0.27 (n = 14 zebrafish), Q331K:OA = 1.43 ± 0.39 (n = 14 zebrafish). Values are mean ± S.E.M. F(2,39) = 81.83, ****P < 0.0001 for CON versus G93A:Non and CON versus Q331K:Non;F(2,55) = 21.78, ####P < 0.0001 for G93A:CON versus G93A:I-2 and G93A:CON versus G93A:OA; F(2,39) = 25.12, &&&&P < 0.0001 for Q331K:CON versus Q331K:I-2 and Q331K:CON versus Q331K:OA by one-way ANOVA followed by Tukey’s multiple comparisons test. c Analysis of axonal length in (a). CON = 162.5 ± 2.77 (n = 6 zebrafish), G93A:Non = 122 ± 2.96 (n = 13 zebrafish), G93A:Mdivi-1 = 141.4 ± 2.45 (n = 13 zebrafish), G93A:I-2 = 151.1 ± 1.56 (n = 14 zebrafish), Q331K:Non = 23.3 ± 5.82 (n = 10 zebrafish), Q331K:Mdivi-1 = 141.3 ± 3.37 (n = 14 zebrafish), Q331K:I-2 = 145.3 ± 3.14 (n = 14 zebrafish). Values are mean ± S.E.M. F(2,26) = 21.27, ****P < 0.0001 for CON versus G93A:Non and CON versus Q331K:Non;F(2,37) = 39.83, ####P < 0.0001 for G93A:CON versus G93A:Mdivi-1 and G93A:CON versus G93A:I-2, #P = 0.0156 for G93A:Mdivi-1 versus G93A:I-2;F(2,35 )= 7.755, &P = 0.0104 for Q331K:CON versus Q331K:Mdivi-1, &&P = 0.0017 for Q331K:CON versus Q331K:I-2 by one-way ANOVA followed by Tukey’s multiple comparisons test. d Immunostaining of cleaved caspase-3 and ChAT in 3-week-old MNs of control and mTDP-43 lines treated with 80 nM I-2 every other day for 2 weeks. Scale bar, 25 μm. e Measurement of mitochondrial length in 3-week-old MNs of control and mTDP-43 lines treated with 80 nM I-2 every other day for 2 weeks. CON:I-2(−) = 2.42 ± 0.07 (n = 38 ChAT+ neurons), CON:I-2(+) = 3.24 ± 0.13 (n = 37 ChAT+ neurons), mTDP-43:I-2(−) = 1.75 ± 0.06 (n = 38 ChAT+ neurons), mTDP-43:I-2(+) = 2.63 ± 0.11 (n = 36 ChAT+ neurons). Values are mean ± S.E.M. F(1,74) = 6.837, ****P < 0.0001 for CON:I-2(−) versus mTDP-43:I-2(−); F(1,73) = 5.538, ****P < 0.0001 for CON:I-2(−) versus CON:I-2(+); F(1,72) = 6.840, ****P < 0.0001 for mTDP-43:I-2(−) versus mTDP-43:I-2(+) for by two-sided Student’s t-test. f Quantification of cleaved caspase-3+ cell in human iPS-derived ChAT+ neuron in (d). CON:I-2(−) = 7.86 ± 0.42 (n = 3 iPS cell lines), CON:I-2(+) = 7.96 ± 0.89 (n = 3 iPS cell lines), mTDP-43:I-2(−) = 31.47 ± 3.34 (n = 3 iPS cell lines), mTDP-43:I-2(+) = 15.67 ± 2.06 (n = 3 iPS cell lines). Values are mean ± S.E.M. F(1,4) = 7.01, **P = 0.0022 for CON:I-2(−) versus mTDP-43:I-2(−); F(1,4) = 4.03, *P = 0.0158 for mTDP-43:I-2(−) versus mTDP-43:I-2(+) for by two-sided Student’s t-test. g Quantification of pyknotic cell in ChAT+ neuron in (d). Values are mean ± S.E.M. (N = 3 lines in CON and mTDP-43; *p < 0.05, **p < 0.01 in two-sided Student’s t-test). CON:I-2(−) = 14.37 ± 0.84 (n = 3 iPS cell lines), CON:I-2(+) = 10.43 ± 0.75 (n = 3 iPS cell lines), mTDP-43:I-2(−) = 7.11 ± 4.04 (n = 3 iPS cell lines), mTDP-43:I-2(+) = 18.99 ± 1.71 (n = 3 iPS cell lines). Values are mean ± S.E.M. F(1,4) = 5.514, **P = 0.0053 for CON:I-2(−) versus mTDP-43:I-2(−); F(1,4) = 4.131, *P = 0.0145 for mTDP-43:I-2(−) versus mTDP-43:I-2(+) for by two-sided Student’s t-test.
|