FIGURE

Fig. 5

ID
ZDB-FIG-201003-113
Publication
Constantin et al., 2020 - Altered brain-wide auditory networks in a zebrafish model of fragile X syndrome
Other Figures
All Figure Page
Back to All Figure Page
Fig. 5

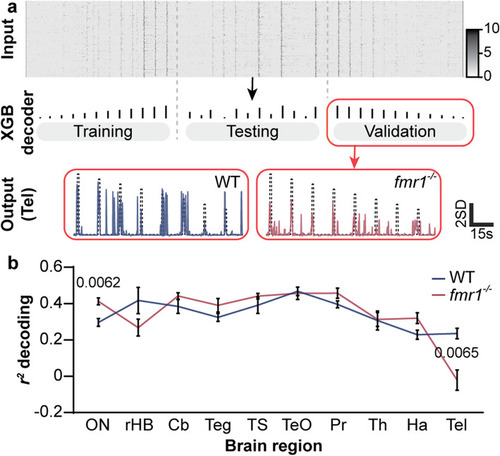
Population decoding of sound amplitude in different WT and fmr1−/− brain regions. Workflow (a) of population decoding analysis. For each brain region of interest, the neuronal activity in ROIs for each genotype (raster plot, top) was randomly split into 10 cross-validation subsets. “Ascending” auditory stimuli were fed to train the Xtreme Gradient Boosting (XGB) decoder, the “quasi-random” auditory stimuli were used to test the decoder, and the “descending” auditory stimuli to validate the predictions. The output of the decoder analysis for the telencephalon (tel) is shown (bottom) as a time trace of the stimulus features (black dotted line) versus predicted responses (colored solid line). Mean r2 (b) of auditory clusters decoding amplitude intensity in WT and fmr1−/− larvae for brain regions of interest. Note brain regions are depicted in approximate order of the ascending sensory pathway. ON, octavolateralis nucleus; rHB, remaining hindbrain (without the cerebellum (Cb) and ON); Teg, tegmentum; TS, torus semicircularis; TeO, optic tectum; Pr, pretectum; Th, thalamus; Ha, habenulae; Tel, telencephalon. Corrected P values ≤ 0.01 are shown

Expression Data

Expression Detail
Antibody Labeling
Phenotype Data
Fish:
Observed In:
Stage: Day 6

Phenotype Detail
Acknowledgments
This image is the copyrighted work of the attributed author or publisher, and ZFIN has permission only to display this image to its users. Additional permissions should be obtained from the applicable author or publisher of the image. Full text @ BMC Biol.