FIGURE

Fig. 3

ID
ZDB-FIG-201003-111
Publication
Constantin et al., 2020 - Altered brain-wide auditory networks in a zebrafish model of fragile X syndrome
Other Figures
All Figure Page
Back to All Figure Page
Fig. 3

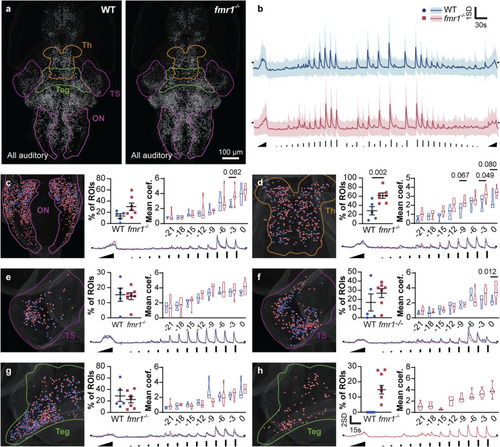
Regional responses to a complex auditory stimulus train. Auditory responsive ROIs (a) in WT and fmr1−/− larvae (equivalent to five larvae). Z-scored activity trace (b) of all responsive ROIs (mean ± SD) with stimulus timing and amplitude represented (bottom). For each of six functional clusters across four brain regions (ch), the distribution of responsive ROIs (left), percent of all ROIs belonging to the cluster, mean response strength to each of eight stimulus amplitudes (top right), and mean z-scored activity trace during the first amplitude ramp and first twelve discrete amplitudes (bottom right). Spheres (ch, left) are color coded to genotype. Amplitudes are represented in decibels (dB) from full volume. ON, octavolateralis nucleus; Teg, tegmentum; TS, torus semicircularis; Th, thalamus. P values ≤ 0.1 are shown

Expression Data

Expression Detail
Antibody Labeling
Phenotype Data
Fish:
Observed In:
Stage: Day 6

Phenotype Detail
Acknowledgments
This image is the copyrighted work of the attributed author or publisher, and ZFIN has permission only to display this image to its users. Additional permissions should be obtained from the applicable author or publisher of the image. Full text @ BMC Biol.