FIGURE

Figure 5.

ID
ZDB-FIG-200912-12
Publication
Wragg et al., 2020 - Embryonic tissue differentiation is characterized by transitions in cell cycle dynamic-associated core promoter regulation
Other Figures
All Figure Page
Back to All Figure Page
Figure 5.

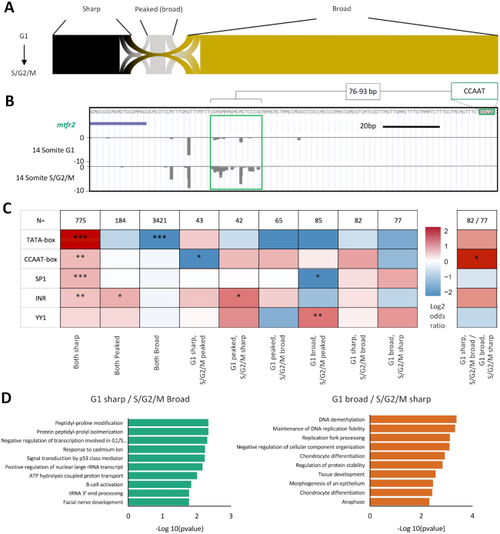
Core promoter shape transition. Promoter interquantile width (IQW) was measured and dominant TSSs assigned for consensus clusters (CCs) with at least 10 tpm expression in both the G1 and S/G2/M populations (n = 4774). Promoters were segregated into three groups based on promoter TSS distribution (shape), sharp (IQW < 10 bp), peaked broad (IQW > 10 bp, dominant TSS > 60% of CC expression) and broad (IQW > 10 bp, dominant TSS <60% of CC expression). (A) Sankey plot of promoter shape correspondence between G1 and S/G2/M. (B) UCSC genome browser view of the mitochondrial fission regulator 2 (mtfr2) promoter with a shape change transition between populations, broadening TSS distribution in the S/G2/M population versus G1. A proximal regulatory element (CCAAT-box) is highlighted along with its spatial proximity to the main region of differential TSS utilization in this promoter (green box). (C) Heatmap visualizing the log2 odds ratio of selected promoter motif occurrence for promoters transitioning in shape. Left heat map, occurrence is scored in each group versus the rest of the dataset of shared CCs >10 tpm expression (n = 4774). Right heatmap, comparison is as shown (*P< 0.05, **P< 0.01, ***P< 0.001, Fisher's exact test). (D) Gene ontology of biological processes of genes with promoters transitioning from sharp to broad between populations, with corresponding P-values shown.

Expression Data

Expression Detail
Antibody Labeling
Phenotype Data

Phenotype Detail
Acknowledgments
This image is the copyrighted work of the attributed author or publisher, and ZFIN has permission only to display this image to its users. Additional permissions should be obtained from the applicable author or publisher of the image. Full text @ Nucleic Acids Res.