
FIGURE
Figure 1
- ID
- ZDB-FIG-200826-15
- Publication
- Cosacak et al., 2020 - Protocol for Dissection and Dissociation of Zebrafish Telencephalon for Single-Cell Sequencing
- Other Figures
- All Figure Page
- Back to All Figure Page
Figure 1
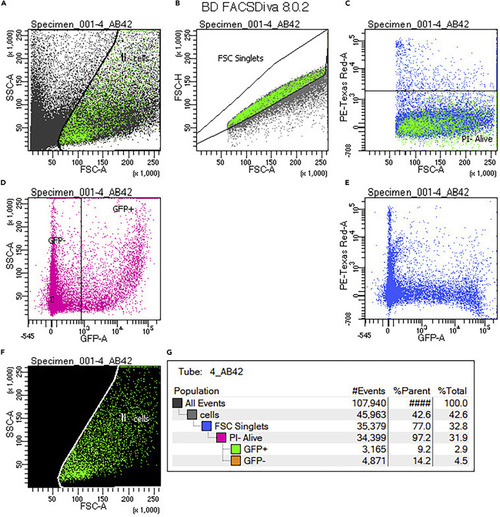
Exemplary Histogram of Cell Sorting for Single Cell Sequencing (A) The cells selected based on side and forward scattering (SSC/FSC). (B) FSC singlet cells shown. (C) Propidium iodide dye-negative cells (live cells). (D) GFP-negative and GFP-positive cells. (E) Pet-Texas Red (PI-) and GFP-positive cells. (F) Sorted cells. (G) Cells sorting tree. Adapted from |
Expression Data
Expression Detail
Antibody Labeling
Phenotype Data
Phenotype Detail
Acknowledgments
This image is the copyrighted work of the attributed author or publisher, and
ZFIN has permission only to display this image to its users.
Additional permissions should be obtained from the applicable author or publisher of the image.
Full text @ STAR Protoc