
Figure 4.
- ID
- ZDB-FIG-200822-30
- Publication
- Zimmerli et al., 2020 - TBX3 acts as tissue-specific component of the Wnt/β-catenin transcriptional complex
- Other Figures
- All Figure Page
- Back to All Figure Page
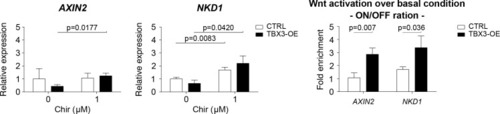
(A) β-Catenin/TCF luciferase reporter STF assay in parental (left), β-catenin knockout (Δβ-CAT, center) and TCF knockout (Δ4TCF, right) HEK293T cells. Cells were treated with the indicated concentration of Chir or DMSO, overnight. Overexpression of TBX3 (OE, black bars) compared to control (EV, empty vector, white bars) showed that TBX3 acts as a repressor on a Wnt/TCF pathway reporter, but switches to activator upon pathway induction. Only significant p-values (p<0.05) are indicated. Three independent experiments (N = 3) are shown. Note that the logarithmic scale on the y-axis of the histogram on the left is different from the linear scale of the central and middle panels. (B) ChIP followed by qPCR in HEK293T cells treated with DMSO (‘WNT-OFF’) or Chir (‘WNT-ON’). Enrichment was identified on AXIN2 promoter and the downstream enhancer. Note that the enrichment on the enhancer is only present upon pathway stimulation: we interpret this as evidence for the enhancer looping onto the promoter occurring when the Wnt-dependent transcriptional regulation is active. The data are normalized to immunoprecipitation performed in cells transfected with an empty vector (EV) and presented as the mean ± standard deviation of independent experiments. The fold enrichment of TBX3-FLAG on AXIN2 promoter and enhancer (N = 4) is lost upon mutations in BCL9/9L (ΔB9/9L, N = 2), CNTTB1 (ΔΒ-CAT, N = 2) and TCF/LEF (Δ4TCF, N = 2). (C) Schematic representation of the AXIN2 locus indicates the position of the primers used (black arrows) to test the binding of TBX3. Despite the apparent absence of direct physical interaction between TBX3 and BCL9/9L, the data support a model of TBX3 recruitment by BCL9/9L onto the β-catenin/TCF transcriptional complex. (D) Schematic diagram of the human CRC zebrafish xenografts model. Parental and TBX3- overexpressing HCT116 colorectal tumor cells were harvested and labeled with DiI dye (red). The stained cells were injected into the perivitelline space of 3 day old zebrafish embryos. Zebrafish were visualized with fluorescent microscopy at 0 day post injection (dpi) and three dpi, and primary tumor cell invasion and metastasis were counted. (E) Representative images of HCT116 tumor invasion and dissemination at 0 and 3 dpi in zebrafish xenografts, for both control and TBX3 overexpressing cells. The red asterisks indicate the position of the primary tumor. Red arrowheads point at clusters of disseminating/metastatic cells. (F) Scatter plot representing the quantification of primary tumor growth and metastasis after HCT116 xenograft. Horizontal bars represent the mean value. Only significant p-values (p<0.05) are displayed. (G) Quantitative RT-PCR confirmed continued increased expression of TBX3 while HCT116 disseminate through zebrafish tissue, and that this is accompanied by enhanced Wnt/β-catenin transcription, as seen by AXIN2 expression. Each datapoint represents the extraction of total RNA from pools of 10 zebrafish embryos. Figure Legend of Figure Supplements. |