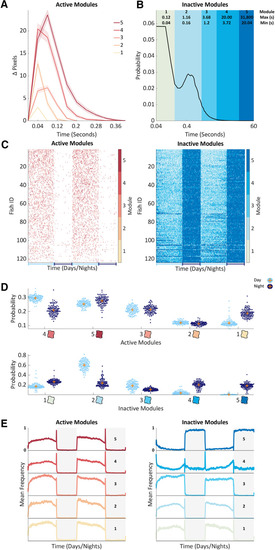
Unsupervised learning identifies contextual behavioral modules. A, Average Δ pixels changes for each active module. Shown is the mean (bold line) and SEM (shaded surround) of 100 bouts randomly sampled from each module from one representative larva. Modules are numbered and colored by average module length across all animals, from shortest (1) to longest (5). B, A probability density curve showing the distribution of inactive bout lengths in seconds, on a log x-axis cropped to 60 s. Modules are numbered and colored from shortest (1) to longest (5) mean length (see legend for each module’s minimum and maximum bout length). C, Matrices showing the active (left) or inactive (right) module assignment of every frame (x-axis) for each of 124 wild-type larvae (y-axis) across the 14-h days (light blue underlines) and 10-h nights (dark blue underlines) from 5 to 6 dpf. Larvae were sorted by total number of active modules from highest (top) to lowest (bottom). Modules are colored according to the adjacent colormaps. D, Average active (upper) and inactive (lower) module probability during day (light blue) and night (dark blue) 5 and 6 of development. Each of 124 wild-type animals is shown as a dot and orange crosses mark the population means. Active modules are sorted by mean day probability from highest to lowest (left to right). Inactive modules are sorted by mean length from shortest to longest (left to right). The blobs correspond to the color used for each module in other figures. E, The mean frequency of each active (left) and inactive (right) module across days 5 and 6 of development. Shown is a mean smoothed with a 15-min running average, rescaled to 0–1. Days are shown with a white background, nights with a dark background. Modules are sorted from shortest to longest (lower to upper panels). Extended Data Figures 2-1, 2-2 support Figure 2.
|
