
FIGURE
Figure 6
- ID
- ZDB-FIG-200803-11
- Publication
- Rassier et al., 2020 - Evaluation of qPCR reference genes in GH-overexpressing transgenic zebrafish (Danio rerio)
- Other Figures
- All Figure Page
- Back to All Figure Page
Figure 6
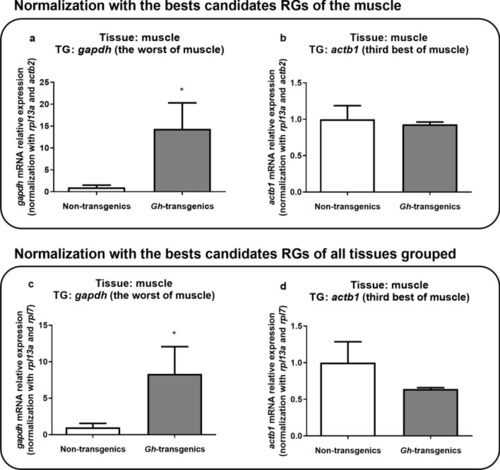
Verification of the suitability of the reaction when normalized with the candidate reference genes ranked as the best for muscle tissue ( |
Expression Data
Expression Detail
Antibody Labeling
Phenotype Data
Phenotype Detail
Acknowledgments
This image is the copyrighted work of the attributed author or publisher, and
ZFIN has permission only to display this image to its users.
Additional permissions should be obtained from the applicable author or publisher of the image.
Full text @ Sci. Rep.