
- Title
-
Evaluation of qPCR reference genes in GH-overexpressing transgenic zebrafish (Danio rerio)
- Authors
- Rassier, G.T., Silveira, T.L.R., Remião, M.H., Daneluz, L.O., Martins, A.W.S., Dellagostin, E.N., Ortiz, H.G., Domingues, W.B., Komninou, E.R., Kütter, M.T., Marins, L.F.F., Campos, V.F.
- Source
- Full text @ Sci. Rep.
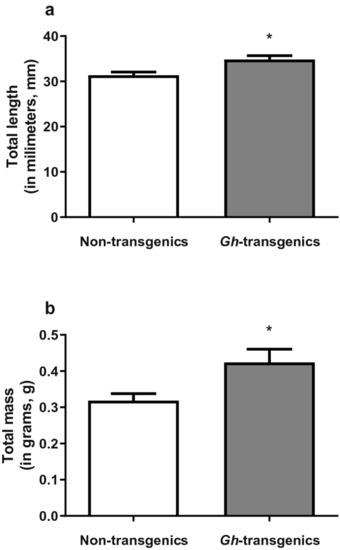
Biometry of non-transgenic and |
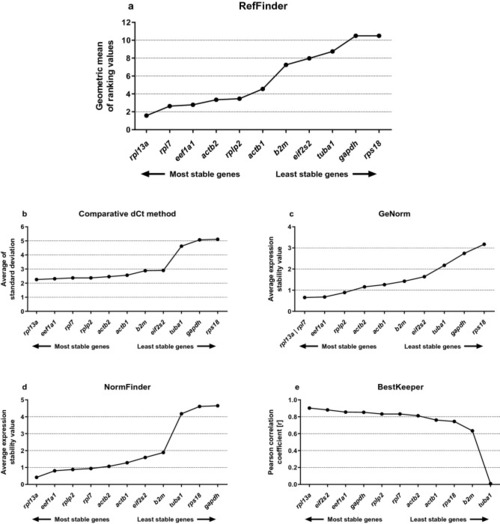
Consensus stability analyses of the candidates reference genes (RGs) grouping non-transgenic and |
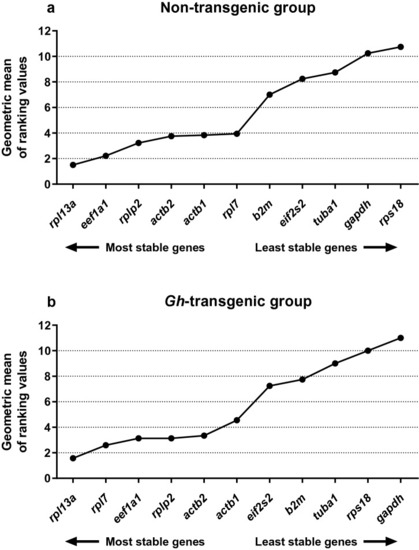
Consensus stability analysis in non-transgenic and |
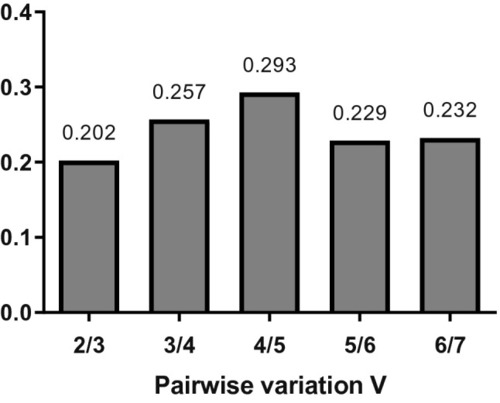
Graphical representation of the pairwise variation analysis. Y-axis represents V value and X-axis represents the number of reference genes used to normalize the reaction. The lowest value is found for 2/3 reference genes, what means that the addition of a third reference gene is superfluous to obtaining reliable results in experiments using non-transgenic and |
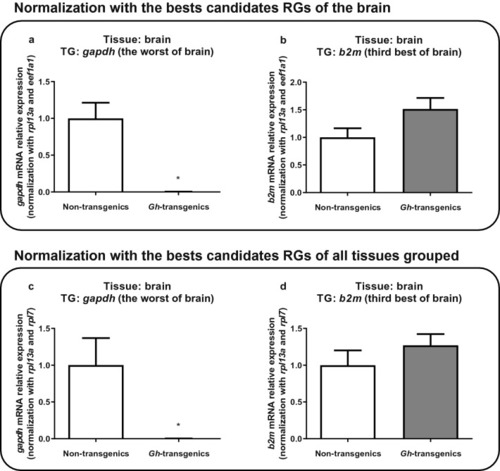
Verification of the suitability of the reaction when normalized with the candidate reference genes ranked as the best for brain tissue ( |
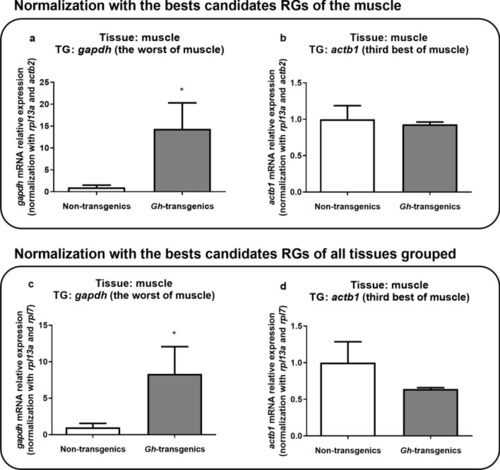
Verification of the suitability of the reaction when normalized with the candidate reference genes ranked as the best for muscle tissue ( |
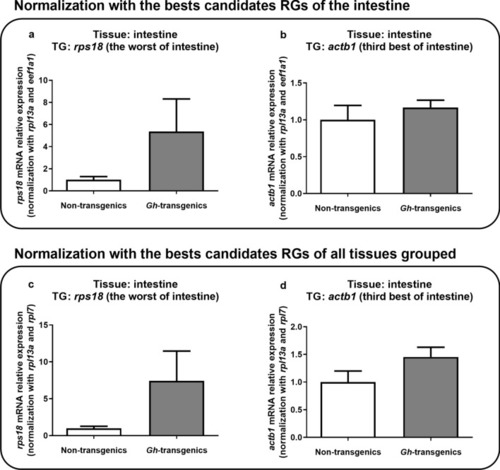
Verification of the suitability of the reaction when normalized with the candidate reference genes ranked as the best for intestine tissue ( |
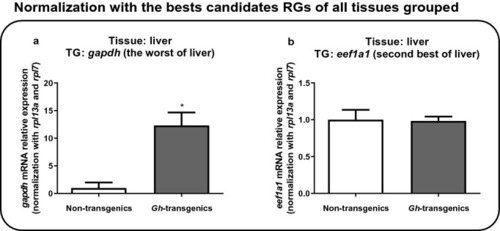
Verification of the suitability of the reaction when normalized with the candidate reference genes ranked as the best for all tissues grouped ( |