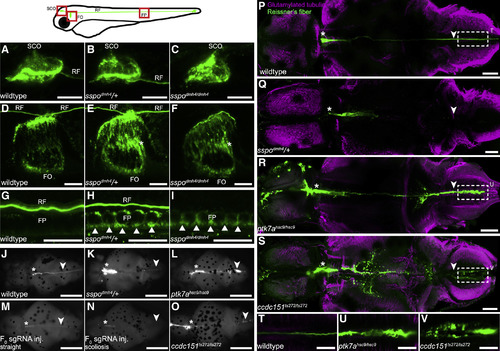
Idiopathic-like Scoliosis Is Associated with Irregularities in Sspo Localization (A–I) Whole-mount immunostaining was performed on 2-dpf embryos using an antibody raised against bovine Reissner’s substance. Whole embryos were imaged using a LSM710 confocal microscope (Zeiss). Z stacks were collected and processed using ImageJ. Maximum intensity projections are shown. Lateral mounts are anterior to the left. FO, flexural organ; FP, floorplate; SCO, subcommissural organ. Scale bars represent 20 μm. The SCO (A–C) and FO (D–F), which secrete Sspo, are immunoreactive in all embryos at 2 dpf. Sspo aggregation into RF is clearly visible within the brain and spinal cord of wild-type (A, D, and G; N = 3; n = 9) and sspodmh4/+ embryos (B, E, and H; N = 3; n = 9) but absent in sspodmh4/dmh4 embryos (C, F, and I; N = 3; n = 12). Instead, sspodmh4/dmh4 mutants display abnormal accumulation of Sspo within cells of the FO (asterisks; F) and FP (arrowheads; I). Similar intracellular accumulations of Sspo can also be observed in sspodmh4/+ embryos (E and H). (J–O) Dorsal whole-mount images of brains dissected from juvenile (21-dpf) zebrafish immunostained for Sspo. Positions of the SCO (asterisk) and RF (arrowhead) are indicated. Images were acquired using a Zeiss V16 Axio Zoom compound fluorescent microscope. Anterior to the left is shown. In wild-type animals (J), Sspo is localized to both SCO and RF (N = 3; n = 8). sspodmh4/+ brains (K) exhibit ectopic Sspo accumulation around the SCO, and RF staining is not detected (N = 2; n = 8). ptk7ahsc9/hsc9 (L) mutants demonstrate irregular Sspo accumulations throughout the brain, most notably in the anterior region near the SCO as well as in the fourth ventricle (N = 1; n = 7). Juvenile F0 sspo sgRNA-injected fish that appear phenotypically normal (M) exhibit clear Sspo staining within the SCO and RF (N = 2; n = 5). However, RF staining is absent in all scoliotic F0 sspo sgRNA-injected animals (N; N = 2; n = 8). ccdc151ts272/ts272 (O) mutants demonstrate pronounced Sspo accumulations anterior to the SCO within the third ventricle and disrupted RF staining (N = 1; n = 5). Scale bars represent 500 μm. (P–S) Maximum-intensity Z projections for stacks of dorsal confocal images taken through brains dissected from juvenile (21-dpf) zebrafish immunostained for glutamylated tubulin (magenta) and Sspo (green). Higher resolution micrographs highlight normal Sspo localization in wild-type animals (P; N = 4; n = 11) and the irregular distribution of Sspo in sspodmh4/+ (Q; N = 2; n = 7), ptk7ahsc9/hsc9 (R; N = 9; n = 35), and ccdc151ts272/ts272 (S; N = 1; n = 4) mutant fish. Normal positions of the SCO (asterisk) and RF (arrowhead) are indicated. Images were acquired using a Zeiss LSM710 confocal microscope and processed using ImageJ. Anterior is to the left. Scale bars represent 100 μm. (T–V) Single confocal images isolated from Z projections (above) demonstrate Sspo condensation into RF in wild-type animals (T) but irregular ventricular accumulation of Sspo and the absence of a defined RF in both ptk7ahsc9/hsc9 (U) and ccdc151ts272/ts272 (V) scoliotic juvenile fish. Scale bars represent 50 μm. See also Figure S3.
|
