
Fig. 2
- ID
- ZDB-FIG-200723-47
- Publication
- Xu et al., 2020 - Unifying Developmental Programs for Embryonic and Post-Embryonic Neurogenesis in the Zebrafish Retina
- Other Figures
- All Figure Page
- Back to All Figure Page
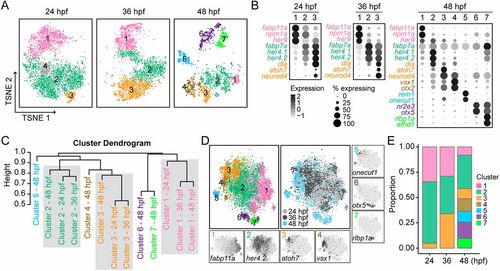
Defining cellular heterogeneity of embryonic RPCs. (A) Visualization of distinct clusters of different-staged embryonic RPCs using t-SNE. Cells are colored by their cluster assignments. Clusters are indicated by their corresponding labels. (B) Dot plots for the expressions of cluster-specific marker genes at different stages. Genes are colored by their cluster assignments. Circle size is proportional to the percentage of cells expressing the marker, and its intensity depicts the average transcript count within expressing cells. (C) Hierarchal clustering of distinct clusters of RPCs from different stages (Jaccard distance metric, average linkage). (D) t-SNE plots show distinct clusters from different embryonic stages after CCA alignment. The left big plot shows the cell distributions of aligned clusters; the right big plot shows the cell distributions of different embryonic stages. The expression patterns of cluster-specific marker genes are indicated in seven small plots. (E) The proportions of distinct clusters across different developmental stages. |