
Fig. 7
- ID
- ZDB-FIG-200714-19
- Publication
- Sidhwani et al., 2020 - Cardiac function modulates endocardial cell dynamics to shape the cardiac outflow tract
- Other Figures
- All Figure Page
- Back to All Figure Page
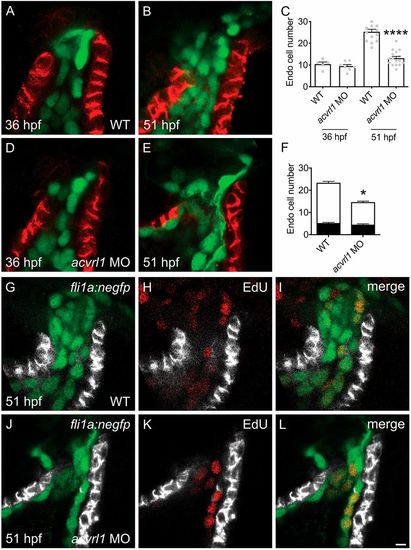
Acvrl1 promotes OFT endocardial expansion, but is not required for endocardial proliferation. (A-E) Lateral slices (A,B,D,E) through the OFT (as in Fig. 1C) illustrate the number of OFT endocardial cells at 36 (A,D) and 51 (B,E) hpf. At 36 hpf, wild-type (WT) (A) and acvrl1 morphant (D) embryos have similar numbers of OFT endocardial cells (n=5, 8; N=2). However, by 51 hpf, acvrl1 morphants (E) have significantly fewer OFT endocardial cells compared with WT (B) (n=14, 16; N=2). Bar graph (C) indicates mean±s.e.m. (****P<0.0001, difference from WT, Student's t-test). (F-L) Lateral slices (G-L) through the OFT at 51 hpf (as in Fig. 2A-C) illustrate EdU incorporation between 36 and 51 hpf in WT (G-I) and acvrl1 morphant (J-L) embryos. Black and white bars in graph (F) represent mean number of EdU+ and EdU− endocardial cells, respectively (mean±s.e.m). The reduced number of OFT endocardial cells in acvrl1 morphants is not a consequence of defective proliferation, as the number of EdU+ cells in the acvrl1 morphant OFT (J-L) is similar to that in WT (G-I), resulting in an acvrl1 morphant PI of 29.1±2.7%, which is significantly higher than that of WT (PI=21.5±1.9%) (n=8, 7; N=2; *P<0.05, difference in PI from WT, Student's t-test). Scale bar: 5 μm. |