|
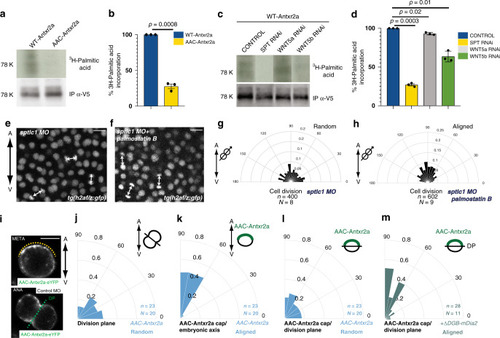
Sphingolipids regulate Antxr2a palmitoylation to control oriented divisions.a, c3H-palmitate incorporation assay. Representative blots showing 3H-palmitate levels incorporated into WT-zAntxr2 or AAC-zAntxr2a expressed in HeLa cells (a) or into WT-zAntxr2a expressed in either Control, SPT, WNT5a or WNT5b RNAi HeLa cells (c). b, d Quantification of 3H-palmitate incorporation as shown in (a, c), normalized to the average of incorporation in WT-zAntxr2a from three independent experiments. Silencing SPT or WNT5b results in a reduction of Antxr2a palmitoylation levels. WNT5a silencing causes a mild, but statistically significant effect on receptor palmitoylation. Data are represented as the mean value +/– SEM. Unpaired, two-tailed student’s t-test was used. e–h Division orientation of epiblast cells with respect to the A/V embryonic axis. e, f Representative confocal images of epiblast cells expressing H2A-GFP in sptlc1 morphants (e) or in sptlc1 morphants treated with palmostatin B (f) from at least eight independent experiments. Division axes are marked by arrows. Animal pole is up. Scale bars: 10 µm. g, h Polar graphs showing the frequency distribution of the angle between the division axis and the A/V axis in sptlc1 morphants and sptlc1 morphants treated with palmostatin B. χ2 test was used (see Supplementary Table 1). i Representative confocal images from a time-lapse movie of a dorsal epiblast cell at metaphase (META) and anaphase (ANA) expressing AAC-Antxr2a-eYFP in control morpholino-injected embryos. Yellow dashed line corresponds to AAC-Antxr2a cap. Green dashed line, division plane (DP). Embryos are oriented with the animal pole up. Embryonic axis is represented by a bi-directional arrow on the right. Scale bars: 10 µm. j–m Polar graphs showing the frequency distribution of either the angle between the division plane (green dashed line in i) and the A/V embryonic plane (j), the angle between the Antxr2a cap and the A/V embryonic axis (k) or the angle between the cap and the division plane of epiblast cells in live embryos expressing AAC-Antxr2a-eYFP (l) or expressing AAC-Antxr2a and ΔBDG-mDia2 (m). χ2 test was used (see Supplementary Table 1). n (number of cells analyzed) over N (number of embryos). Source data are provided as a Source Data file.
|