|
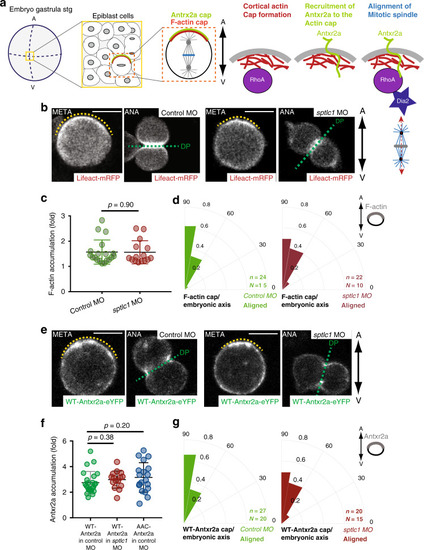
Formation of F-actin and Antxr2a caps are sphingolipid-independent.a Scheme representing the three functions of the actin cytoskeleton during oriented divisions of epiblast cells5. In metaphase, epiblast cells form a polarized F-actin cap aligned with respect to the A/V axis. The formation of this F-actin cap depends on the small GTPase RhoA. The transmembrane protein Antxr2a binds to actin, and it is therefore recruited to and enriched at the actin cap to form a cap itself. Both caps colocalize. Antxr2a interacts then with an active form of RhoA to activate Diaphanous, which connects the mitotic spindle with the caps, rotating the spindle to align it with the caps and therefore with the embryonic axis. As a result, divisions of epiblast cells are oriented along the A/V embryonic axis. b, e Representative confocal images from a time-lapse movie of epiblast cells at metaphase (META) and anaphase (ANA) expressing the F-actin biosensor (Lifeact-mRFP) (b) or Antxr2a-eYFP (e) in control embryos (left panels) or sptlc1 morphants (right panels) from at least ten independent experiments. Yellow dashed line highlights F-actin or Antxr2a cap. Green dashed line, division plane. Animal pole, up. The embryonic axis is represented by a bi-directional arrow on the right. Scale bars: 10 µm. c Quantification of cortical F-actin accumulation at the cap of epiblast cells in control (n = 19 cells; green) and sptlc1 morphants (n = 15 cells; red) expressing Lifeact-mRFP. d, g Polar graphs showing the frequency distribution of the angle between the F-actin cap (d) or the Antxr2a cap (g) and the plane of the A/V embryonic axis in control (left graph) and sptcl1 morphants (right graph). n (number of cells analyzed) over N (number of embryos). In (d, g), χ2 test was used (see Supplementary Table 1). f Antxr2a accumulation at the cap in epiblast cells expressing WT-Antxr2a-eYFP in control (n = 24 cells; green) or in sptlc1 morphants (n = 15 cells; red) and expressing AAC-zAntxr2a-eYFP in control morphants (n = 19 cells; blue). Data in (c, f) are represented as the mean value +/− SEM and an unpaired, two-tailed student’s t-test was used. DP (Division plane). Source data are provided as a Source Data file.
|