
Fig. 6
- ID
- ZDB-FIG-200623-4
- Publication
- Oliveira et al., 2020 - Platinum-triggered Bond-cleavage of Pentynoyl amide and N-propargyl handles for Drug-Activation
- Other Figures
- All Figure Page
- Back to All Figure Page
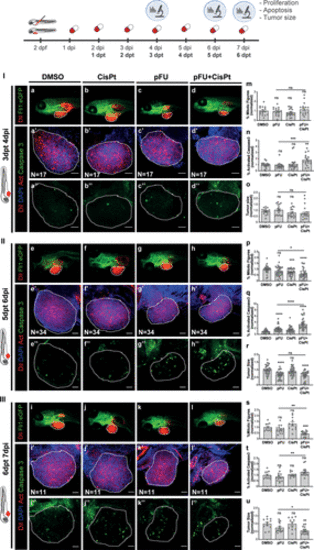
CisPt-mediated prodrug decaging in zebrafish xenografts. HCT116 human CRC cells were fluorescently labeled with lipophilic CM-DiI (shown in red) and injected into the perivitelline space (PVS) 2 days post fertilization (dpf) Tg(Fli1:eGFP) zebrafish larvae. Zebrafish xenografts were randomly distributed into treatment groups, daily treated with DMSO, CisPt, pFU, and pFU+CisPt and analyzed at 4, 6, or 7dpi for proliferation, apoptosis and tumor size. At 4 dpi, 6 dpi, and 7dpi, zebrafish xenografts were imaged by stereoscope (a–l) and by confocal microscopy (a′–l′DAPI plus DiI, a′′–l′′ maximum projection of activated caspase 3). Proliferation (mitotic figures: m; p, *P = 0.0104, ***P = 0.0004, ****P < 0.0001; s, **P = 0.0023, *** P = 0.0002), apoptosis (activated caspase 3: n, **P = 0.0033, ***P = 0.0006; q, *P = 0.0126, ****P < 0.0001; t, **P = 0.0068) and tumor size (n° of tumor cells: o, *P = 0.0279; r, ****P < 0.0001; u, *P = 0.0411, **P = 0.0010) were analyzed and quantified. Graphs represent fold induction (normalized values to controls) of Avg ± SEM. The number of xenografts analyzed is indicated in the representative images and each dot represents one zebrafish xenograft. Statistical analysis was performed using an unpaired test. Statistical results: ns > 0.05, *P ≤ 0.05, **P ≤ 0.01, ***P ≤ 0.001, and ****P ≤ 0.0001. All images are anterior to the left, posterior to right, dorsal up, and ventral down. Scale bar 50 μm. |