|
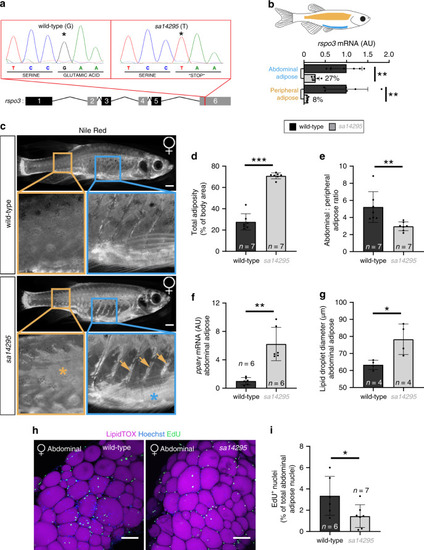
Effects of a nonsense <italic>rspo3</italic> mutation on total and regional adiposity in zebrafish.a Schematic illustrating the location of the sa14295 mutation in exon 6 of zebrafish rspo3. b qRT-PCR for rspo3 in abdominal and peripheral AT in wild-type sibling and sa14295 homozygous (rspo3m/m) adult females (n = 6). c Nile Red staining of adult wild-type and rspo3m/m females (the blue asterisk indicates abdominal AT, whereas, the orange asterisk indicates peripheral AT that extends ventrally as marked by arrowheads). Scale bars = 1 mm. d Total adiposity, expressed as the % of total adipose-lipid area relative to body area, is significantly increased in rspo3m/m adult females. e The ratio of abdominal to peripheral SC AT is decreased in rspo3m/m adult females. f pparγ mRNA is elevated in the abdominal AT of rspo3m/m adult females. g Adipocyte-localised lipid droplets are significantly larger in rspo3m/m adult females. h Maximum intensity projection of female abdominal AT stained with LipidTOX (magenta), Hoechst (blue) and EdU (green). Scale bars = 100 μm. i Quantification showing decreased EdU+ nuclei in abdominal AT of rspo3m/m animals. Two-tailed unpaired Student’s t-test was used for comparisons between genotypes (b, d–g and i). Histogram are means ± s.d. *p < 0.05, **p < 0.01, ***p < 0.001. Source data are provided as a Source Data file.
|