FIGURE

Figure 1—figure supplement 1.

ID
ZDB-FIG-200612-2
Publication
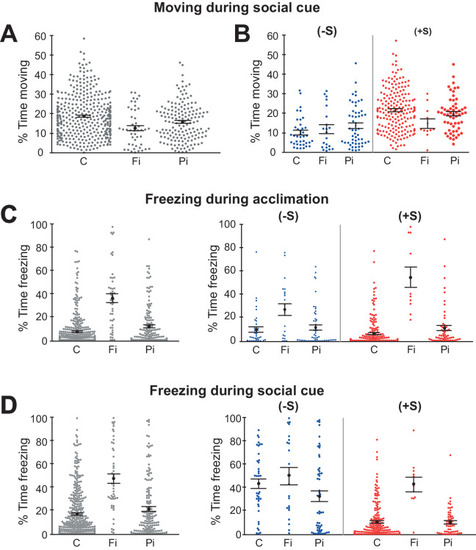
Tunbak et al., 2020 - Whole-brain mapping of socially isolated zebrafish reveals that lonely fish are not loners
Other Figures
All Figure Page
Back to All Figure Page
Figure 1—figure supplement 1.

Isolation alters social preference behaviour and swimming activity.

(A) Swarm plots comparing the activity levels of fish during the social period expressed as percentage time moving for each rearing condition (C, n = 380; Fi, n = 47; Pi, n = 157). Mean and standard errors are shown. (B) Swarm plots comparing the activity levels of anti-social (-S) and pro-social (+S) fish during visual social cue exposure for each rearing condition (anti-social C n = 39; Fi n = 21; Pi n = 53) or social (C n = 193; Fi n = 11; Pi n = 57). (C) (Left) Swarm plots comparing freezes (movement pauses longer than 3 s) for the same groups in A during the acclimation period expressed as percentage time freezing for each rearing condition. (Right) Swarm plots comparing freezes for the separated anti-social (-S) and pro-social (+S) groups in B during the acclimation period. (D) Same presentation as C for the social cue period.

Expression Data

Expression Detail
Antibody Labeling
Phenotype Data

Phenotype Detail
Acknowledgments
This image is the copyrighted work of the attributed author or publisher, and ZFIN has permission only to display this image to its users. Additional permissions should be obtained from the applicable author or publisher of the image. Full text @ Elife