|
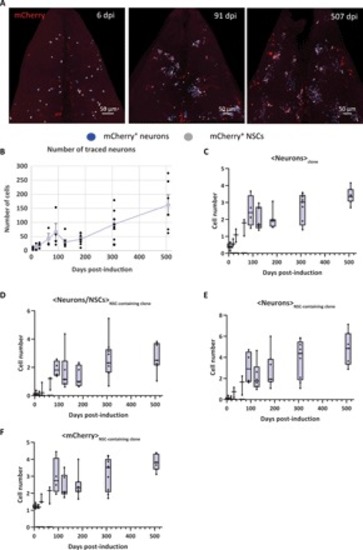
Pallial adult neurogenesis is additive in zebrafish.(A) Dorsal views of the analyzed pallial Dm region at different time points of the clonal analysis. Only the mCherry channel is displayed to highlight the clones. NSCs and neurons are marked by white and blue spots, respectively. (B) Evolution over time of the average number of traced neurons. One-way ANOVA: F(8,37) = 10.12, P < 0.001; all pairwise comparisons: LSD test followed by Holm’s adjustment (the results of pairwise comparisons are given in data file S1). Error bars, SEM. n = 6, 3, 3, 3, 4, 6, 7, 8, and 6 brains at 6, 18, 30, 64, 91, 125, 183, 307, and 507 dpi, respectively. (C) Time evolution of the average number of neurons per clones. (D) Evolution over time of the ratio of neurons to NSCs in the NSC-containing clones. (E) Evolution of the number of neurons per NSC-containing clone across all time points analyzed. (F) Evolution over time of the average clone size. (C to F) Box-and-whisker plot: The horizontal bar indicates the median, the lower and upper edges of the box represent the first and third quartiles, respectively. The whiskers extend to the most extreme data point. Kruskal-Wallis test: P < 0.0001; all pairwise comparisons: Behrens-Fisher tests (for the sake of the graphs readability, the results of pairwise comparisons are given in data file S1). (C to G) n = 6, 3, 3, 3, 4, 6, 7, 9, and 7 brains at 6, 18, 30, 64, 91, 125, 183, 307, and 507 dpi, respectively.
|