|
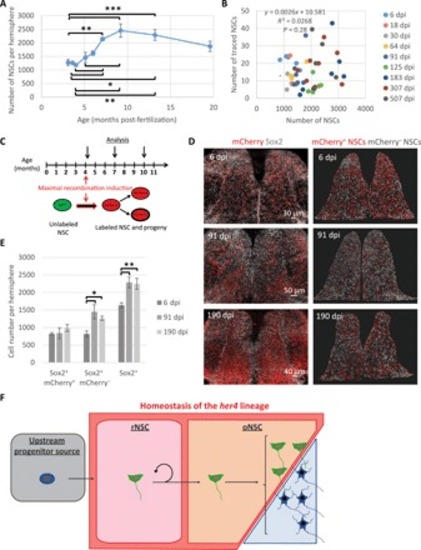
Ongoing production of <italic>her4<sup>+</sup></italic> NSCs by an upstream progenitor source.(A) Quantification of the total number of NSCs (as assessed by Sox2 expression) per hemisphere in the Dm territory of interest. One-way ANOVA: F(8,37) = 8.06, P < 0.001; all pairwise comparisons: LSD test followed by Holm’s adjustment. *P < 0.05, **P < 0.01, and ***P < 0.001. n = 6, 3, 3, 3, 4, 6, 7, 8, and 6 brains at 3.1, 3.6, 4, 5.1, 6, 7.1, 9.2, 13.2, and 19.6 mpf, respectively. Error bars, SEM. (B) Scatter plot showing the absence of correlation between the total numbers of NSCs (Sox2+ cells) in the pallial region analyzed and the number of NSCs (Sox2+ cells) in the traced her4.1 lineage. n = 6, 3, 3, 3, 4, 6, 7, 8, and 6 brains at 6, 18, 30, 64, 91, 125, 183, 307, and 507 dpi, respectively. Cell numbers are per hemisphere. (C) Timeline of the experiment. Maximal recombination of the ubi:Switch reporter was induced by treating her4.1:ERT2CreERT2;ubi:Switch transgenic fish with 4-OHT repetitively over 5 days. (D) Left: Dorsal view of pallia immunostained for mCherry and Sox2 at 6, 91, and 190 dpi. Right: Segmented Sox2+ NSCs (spots). Red spots, NSCs within the her4.1 lineage (Sox2+ and mCherry+); white spots, mostly newly formed NSCs (Sox2+ and mCherry−). (E) Quantification of Sox2+/mCherry+, Sox2+/mCherry−, and Sox2+ cells in the Dm territory of interest (numbers of cells are per hemisphere). One-way ANOVA: Sox2+/mCherry+ cells, F(2,13) = 0.59 and P = 0.5697; Sox2+/mCherry− cells, F(2,13) = 6.02 and P = 0.0141; Sox2+ cells, F(2,13) = 9.06 and P = 0.0034. All pairwise comparisons: LSD test followed by Holm’s adjustment. *P < 0.05 and **P < 0.01. Error bars, SEM. n = 5, 6, and 5 brains at 6, 91, and 190 dpi, respectively. (F) Proposed hierarchical organization of pallial NPs.
|