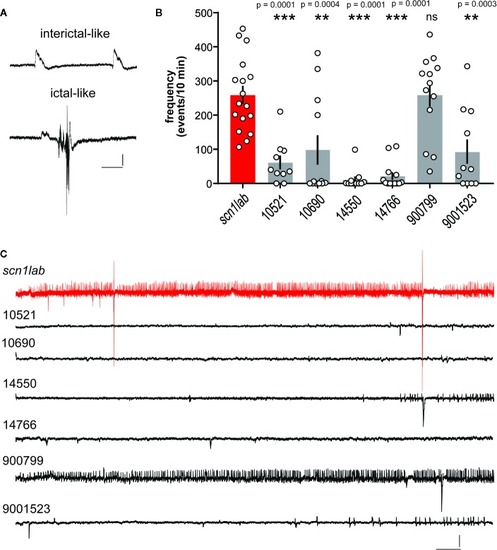
Electrophysiological assay for compounds identified in the locomotion-based screening assay. (A) Local field potential (LFP) recordings were obtained with an glass micro-electrode placed under visual guidance in the midbrain of agar-immobilized scn1lab larvae that had previously showed reduced seizure-like behavior in the locomotion assay. Representative examples of events classified as interictal- or ictal-like are shown. Scale bars: 1 mV, 0.5 s, (B) Bar graphs show the frequency of epileptiform events in a 10 min recording epoch for scn1lab larvae exposed to DMSO vehicle (scn1lab mutants; n = 17), JWH 018 N-(5-chloropentyl) analog (compound #10521; n = 10), JWH 018 N-(2-methylbutyl) isomer (compound #10690; n = 12), 5-fluoro PB-22 5-hydroxyisoquinoline isomer (compound #14550; n = 11), 5-fluoro ADBICA (compound #14766; n = 13), JWH 018 adamantyl analog (compound #9000799; n = 13), and AB-FUBINACA 3-fluorobenzyl isomer (compound #90001523; n = 11). Mean ± SEM and individual data points are shown. One-way analysis of variance with Dunnet's multiple comparisons was used to test for significance. **p < 0.001; *** p < 0.0001. (C) Representative electrophysiology traces (10 min) are shown for SC compounds 10521, 10690, 14550, 14766, 9000799, and 900015323 compared to an scn1lab mutant zebrafish (red). Scale bars: 1 mV, 10 s.
|
